By Institute of Industrial Science, The University of Tokyo
Researchers at the Institute of Industrial Science, The University of Tokyo, enhance land surface maps to identify sloping landscapes in which vegetation changes are associated with slight elevation and water gradients.

Land surface models are an indispensable tool for environmental scientists to map the natural features of our world, particularly when they monitor the effects of climate change or assess conservation efforts.
However, large-scale models that cover massive regions like continents often use grid sizes that don’t adequately capture the variation that can exist within each box. This can be an especially big problem for hilly terrain, in which the elevation, temperature, and water content can be very different, even within a single map pixel.
In a study recently published in the journal Water Resources Research, researchers from the Institute of Industrial Science, The University of Tokyo, demonstrated a new method for visualizing vegetation gradients in hilly terrain. First, the researchers aggregated pixels into bigger hydrological units to represent the hillslope. Then, they discretized the data into vertical height bands to estimate the profile of the slope. This allowed the dominant land cover type in each height band to be determined, and regions where vegetation pattern is affected by hillslopes could then be identified.
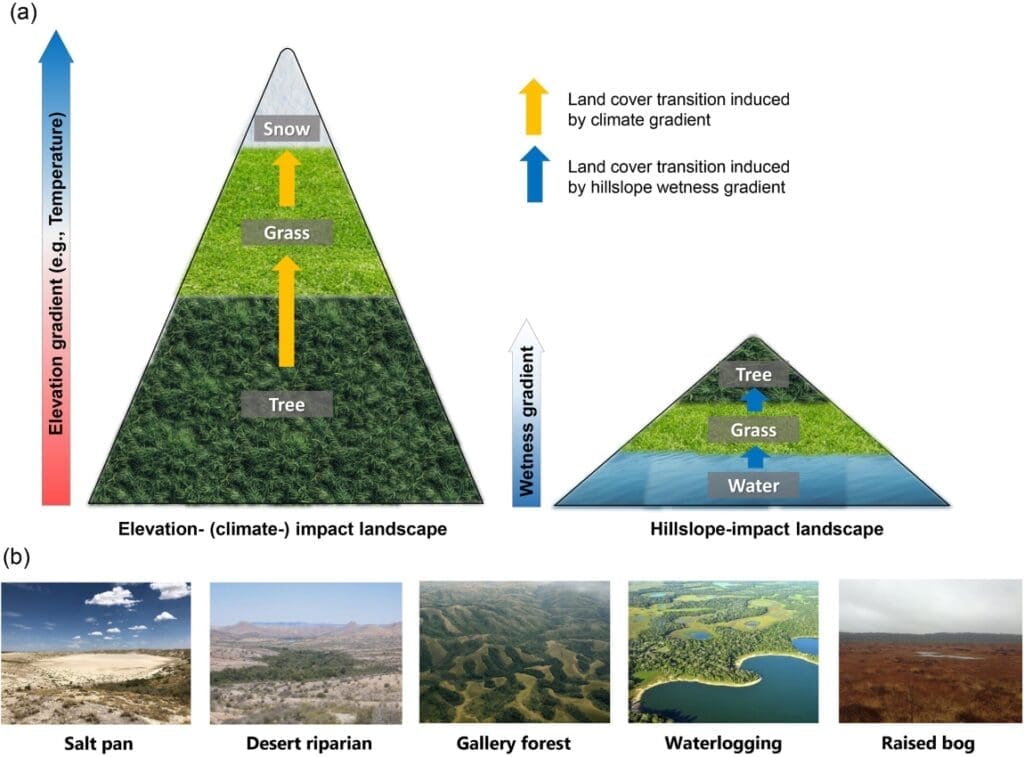
“The difference in moisture between hills and valleys due to a sloping terrain can create unique dynamics and vegetation patterns. In fact, an elevation change of just a few meters can lead to dramatic changes in local flora,” lead author of the study, Shuping Li, explains. The researchers called this phenomenon ‘hillslope-impacted vegetation’.
The extent of hillslope-impacted vegetation was not previously known, or even if it could be identified across the world in different climates.
The new analysis of high-resolution topography and vegetation data showed that it is actually a very common global phenomenon. Regions identified as exhibiting hillslope-impacted vegetation are widely distributed across the world in a variety of climatic zones.
Some examples newly discovered in the study are located in northeastern Russia and the Horn of Africa. This demonstrates that the impact of water dynamics from sloping terrain on vegetation patterns can occur even in dry boreal and semiarid regions.
The researchers also demonstrated that simply calculating the effects of elevation, as with the ‘tree line’ on a mountain above which no trees grow, is not enough.
“We show that just taking into account the impact of altitude–which is mostly due to changes in temperature–is not sufficient to explain the vegetation heterogeneity. The water dynamics on sloped landscapes cannot be ignored as an important factor,” says senior author, Dai Yamazaki.
The researchers believe that their method can be applied to data all over the world to improve our understanding of the effect of elevation changes on plant life, which can significantly assist climate modelling efforts to provide more detailed climate change information.
More information: Shuping Li, Dai Yamazaki, Xudong Zhou, Gang Zhao, ‘Where in the World Are Vegetation Patterns Controlled by Hillslope Water Dynamics?’, Water Resources Research (2024, vol. 60, 4), DOI:10.1029/2023WR036214. Institute of Industrial Science, The University of Tokyo – Press Release; Featured image credit: Freepik


