Paris, France | AFP – The number of tropical cyclones each year has not risen over the past four decades but their intensity has, according to international databases analysed by AFP that confirms the projections of climatologists.
Since 1980 there have been an annual average of 47 tropical cyclones — also called hurricanes and typhoons — according to the database agencies recognised by the World Meteorological Organization (WMO) and coordinated by the US Oceanic and Atmospheric Administration (NOAA).
While that annual frequency has remained relatively constant, the intensity of the cyclones has increased between the 30 years from 1981 to 2010 and the last decade.
Their average maximum speed wind speed has increased to 192 from 182 kilometres per hour (119 from 113 miles per hour) — a five percent increase.
Between 1981 and 2010, around one in 10 tropical cyclones surpassed 250 kph, but that figure has increased to 1.4 in 10 in the last decade.
That is a 40 percent increase in the number of the most devastating, category five cyclones on the Saffir-Simpson scale.
These figures support the conclusions of the UN’s Intergovernmental Panel on Climate Change (IPCC) which show that climate change is expected to increase the number of category four and five cyclones.
“If one can assume climate change is responsible for these trends, make no mistake, the humanitarian catastrophes generated by cyclones are largely due to poverty, vulnerability and a lack of protection for the affected populations,” Robert Vautard, a climatologist and top IPCC official, told AFP.
This year up to December 15, there had been 42 tropical cyclones throughout the world, including 19 that made landfall.
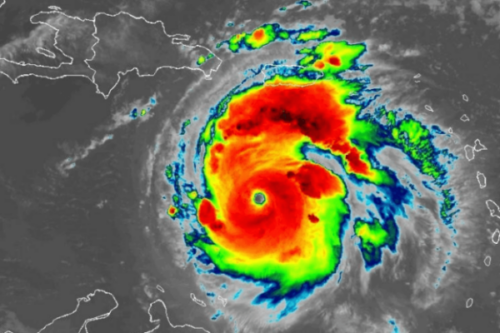
Cyclones are swirling winds around a centre of low atmospheric pressure that reach speeds of at least 118 kph.
The strongest cyclone in 2024 was Hurricane Milton, which battered the US coast on October 10 and reached speeds of 278 kph.
The west Pacific was the worst hit region this year with 15 typhoons, including six in the Philippines alone.
pp-bl/ico/bc/sbk
© Agence France-Presse
Featured image credit: wirestock | Freepik