Table of Contents
Summary:
Street-level vegetation – trees, shrubs, and other greenery lining city roads – is quietly vanishing in many parts of the world. A new study led by Giacomo Falchetta at the International Institute for Applied Systems Analysis (IIASA) offers a global look at this trend, using satellite imagery and machine learning to track changes in what researchers call street green space (SGS).
Published in Environmental Research: Infrastructure and Sustainability, the study covers 190 large cities across 20 global regions, from 2016 to 2023. It introduces an open-source method to estimate the Green View Index (GVI), a measure of canopy coverage based on street-level imagery, and reveals that global SGS has declined by an average of 0.3% to 0.5% per year. Some areas, particularly parts of Asia and Oceania, saw much sharper drops. In contrast, cities in Europe and North America showed modest increases. The research also highlights serious disparities: street greenery tends to be sparse in lower-income neighborhoods, raising questions about fairness and resilience as climate extremes intensify.
With real-time monitoring possible using freely available data, the authors hope their method can support more equitable urban greening policies and inform city planners focused on climate adaptation and public health.

Where the green streets were: tracking global urban vegetation
Trees, shrubs, and other plants along roads and sidewalks play an important role in making cities more resilient to climate change, improving public health, and advancing environmental justice. Yet, tracking its distribution and change over time remains a major challenge – especially across large, rapidly urbanizing regions of the world. A new IIASA-led study addresses this gap.
There is a concerning decline in street-level greenery in cities, raising important questions about urban resilience, climate adaptation, and environmental equity. Monitoring exactly how fast trees and other greenery are being lost in the world’s rapidly changing and expanding urban areas is, however, a challenge.
Led by IIASA researcher Giacomo Falchetta, the study introduces a novel, open-source method that enables continuous and large-scale monitoring of vegetation along urban streets using satellite imagery and machine learning.
“Our aim was to develop a method to monitor how much green infrastructure exists along streets and how it changes over time,” explains Falchetta. “Street greenery has well-documented benefits – it reduces urban heat, improves mental health, and can also absorb carbon. But until now, it’s been difficult to track it globally in a consistent and timely way.”
The authors developed a machine learning model to estimate the Green View Index (GVI) – a canopy coverage indicator derived from labeled street-level photographs. The model was trained and validated using data from multiple world cities and applied to 190 large urban areas across 20 global regions.
The results show that on average, during the eight-year period investigated, street greenery has declined globally by 0.3 to 0.5% per year. Some regions – particularly urban areas in Asia and Oceania – saw even sharper declines, with median GVI drops of 1.7% and 2.6% per year, respectively. Meanwhile, cities in Europe and North America showed moderate increases of about 1% annually. In African and Latin American cities, changes were smaller and more inconsistent.
“Not only is greenery decreasing in many places,” notes coauthor Ahmed Hammad, “but it’s also distributed unequally. In many cities, green space is sparse where people live. This disparity raises serious questions of fairness and access, especially as heatwaves and other climate stressors intensify”.
The model allows real-time updates using freely available Sentinel-2 and climate data, offering a scalable tool for city planners and policymakers and supporting the ambitions of UN Sustainable Development Goal 11 (Sustainable Cities and Communities).
The model and data are publicly available and the output data can be combined with other key indicators of urban resource use and impacts including local temperature records from weather stations, energy demand for thermal regulation in buildings, records of the impact of extreme weather events on people and urban infrastructure, climate-related adverse impacts on human health such as morbidity and mortality, as well as subjective wellbeing indicators.
As climate extremes intensify, the authors emphasize that protecting and expanding urban greenery must become a core component of sustainable city planning.
“Our results can support targeted greening policies. With climate extremes on the rise, ensuring equitable access to green space is more urgent than ever. Our work can be a valuable resource for cities to make more informed, just, and targeted greening decisions,” Falchetta concludes.
Journal Reference:
Falchetta, G. and Hammad, A.T., ‘Tracking green space along streets of world cities’, Environmental Research: Infrastructure and Sustainability 5, 025011 (2025). DOI: 10.1088/2634-4505/add9c4
Article Source:
Press Release/Material by Ansa Heyl | International Institute for Applied Systems Analysis (IIASA)
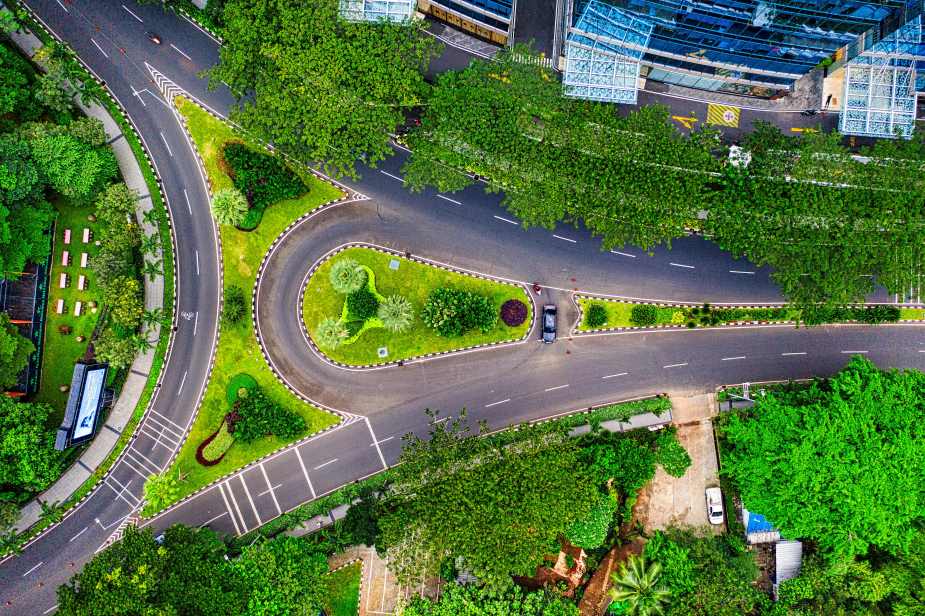
Featured image credit: Tom Fisk | Pexels