January 2025 has been confirmed as the warmest January ever recorded, underscoring the ongoing shift in global climate patterns. Data from the Copernicus Climate Change Service (C3S) shows that the global average surface air temperature for the month reached 13.23°C — 0.79°C higher than the 1991-2020 January average.
More notably, this marks a 1.75°C increase above pre-industrial levels, a significant deviation that reflects the broader warming trend shaping ecosystems, weather patterns, and human infrastructure.
Europe sees dramatic warming
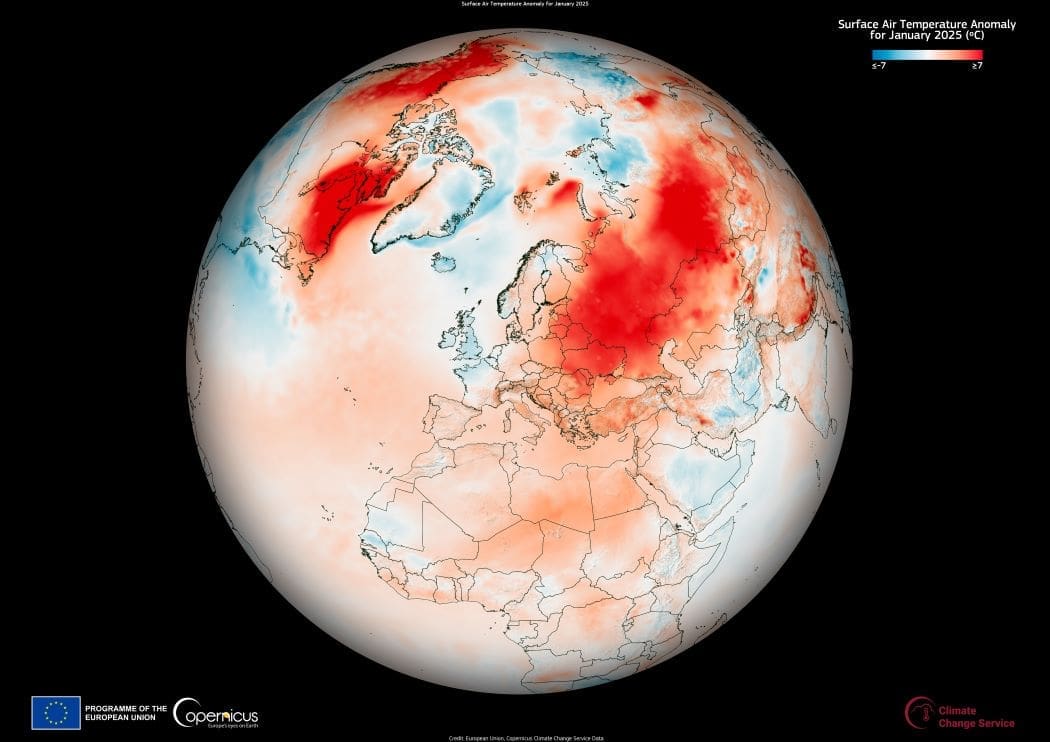
Europe experienced some of the sharpest temperature increases in January 2025. The average temperature over land was 1.80°C, which is 2.51°C above the 1991-2020 January average. This regional spike is part of a pattern driving extreme weather events such as heatwaves, droughts, and flooding across the continent.
C3S data visualizations illustrate areas where temperatures rose well beyond seasonal norms, reinforcing concerns about long-term warming and its effects on agriculture, biodiversity, and infrastructure.

Exceeding the 1.5°C threshold
January 2025 continues a troubling trend: it was the 18th month in the past 19 where global temperatures exceeded 1.5°C above pre-industrial levels. Of those months, 12 — including January — saw temperatures significantly above this threshold, with anomalies ranging from 1.58°C to 1.78°C.
Scientists have long warned that surpassing this limit increases the risk of severe climate consequences, from intensifying extreme weather to disruptions in food and water supplies. The consistency of these elevated temperatures suggests that global warming is advancing at a pace that challenges mitigation efforts.
Tracking climate change with C3S data
The Copernicus Climate Change Service plays a key role in monitoring these shifts. Through its Climate Bulletins and temperature data visualizations, C3S provides crucial information that helps policymakers, scientists, and communities understand and respond to climate trends.
As warming continues, such data will be critical in shaping climate strategies, ensuring that vulnerable regions receive the attention and resources needed to adapt to a changing world.
Featured image credit: European Union, Copernicus Climate Change Service Data