Explore the latest insights from top science journals in the Muser Press daily roundup (July 4, 2025), featuring impactful research on climate change challenges.
In brief:
A Journal of Environmental Sciences study investigates trees best suited for cities
With the world struggling against rising carbon emissions, cities are racing to reduce their carbon footprints and improve air quality with urban forests as their critical allies. But while these green giants absorb carbon dioxide, they release natural emissions which contribute to pollution. These natural emissions are called biogenic volatile organic compounds (BVOCs), which contribute to smog and ground-level-ozone formation. The challenge is to find the right trees that deliver maximum environmental benefit with minimal side effects.
In this vein, a team of researchers led by Associate Professor Xiaoxiu Lun and Professor Qiang Wang from Beijing Forestry University, China, used a data-driven approach to filter out the ideal tree species for urban forests. By combining field surveys with satellite remote sensing data, the researchers mapped the carbon stock and BVOCs emissions of six dominant urban tree species in Beijing, China. Their findings were made available online on June 22, 2024, and were published on October 01, 2025 in Volume 156 of Journal of Environmental Sciences.
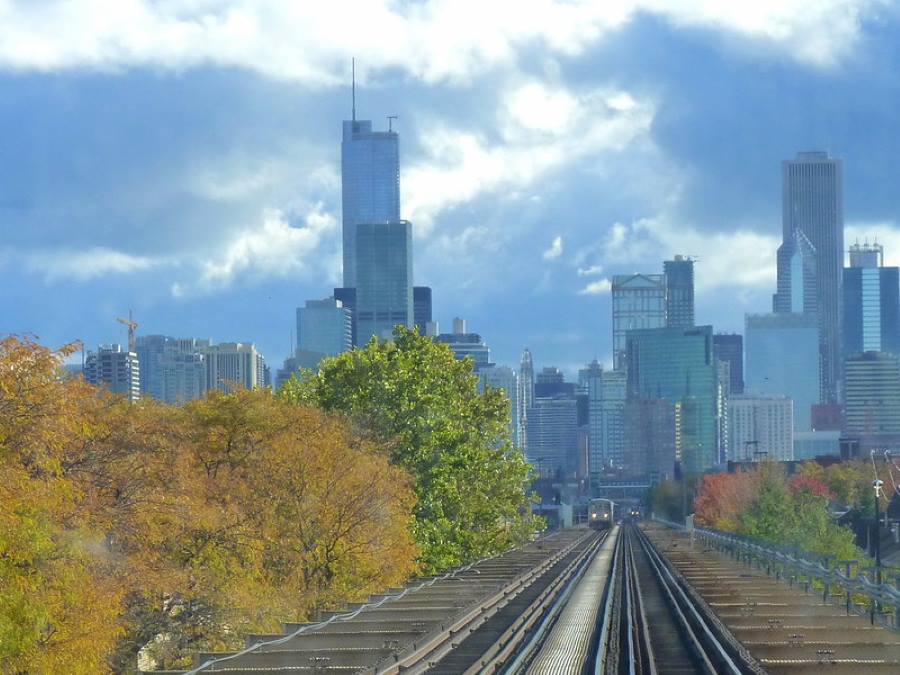
“Urban trees can act as both sinks and sources for environmental pollution,” explains Dr. Lun. “The strategy lies in identifying which trees are more suitable for carbon absorption and reduced BVOC emissions.”
To ensure optimal results, the team used a hybrid methodology that included data derived from ground-based biomass measurements and remote sensing data from two satellite imaging systems – Landsat-8 and Sentinel-2. These data were analyzed using machine learning tools to build a detailed biomass estimation model for each species. These models were then used to calculate above-ground carbon stock and to simulate BVOCs emissions using the globally accepted G95 model, which accounts for temperature, sunlight, and tree physiology.
A total of six species were evaluated including Robinia pseudoacacia, Quercus Linn, Populus tomentosa, Pinus tabulaeformis, Betula platyphylla and Larix gmelinii. Based on the models, the total carbon stock of these species across Beijing’s urban and mountain forests was estimated at 5.638 million tons in 2021, with an average carbon density of 58.86 t/ha. Among them, Robinia pseudoacacia and Populus tomentosa showed the highest carbon densities exceeding 100 t/ha.
However, carbon storage is only half the equation. Plants also emit BVOCs – specifically isoprene, monoterpenes, and other volatile organic compounds. These compounds react with urban air pollutants to form ground-level ozone and secondary organic aerosols affecting air quality. The researchers found that the total BVOCs emissions reached 25,789.72 tons in 2021, with Populus tomentosa and Robinia pseudoacacia being the highest emitters per unit area.
By comparing both carbon density and BVOC emissions per unit area, the researchers identified two optimal species for urban afforestation: Betula platyphylla (white birch), best suited for high-altitude areas, and Robinia pseudoacacia (black locust), ideal for urban plains and low altitudes.
“These species provide the best trade-off – high carbon uptake with low BVOCs emissions,” notes Prof. Wang. “This dual benefit is a key to achieving both pollution control and carbon mitigation in urban ecosystems.”
Interestingly, the study also identified that broad-leaved species like Robinia, Quercus and Populus tend to store more carbon in comparison to conifers. However, not all broadleaves were comparable in BVOC emissions. According to the model, the emission rankings placed Populus tomentosa at the top, which was followed by Robinia pseudoacacia, with Betula platyphylla emitting the least amount of BVOCs.
In conclusion, the study underscores the importance of tree selection in urban afforestation efforts. Looking ahead, the researchers propose that their integrated modeling approach – combining biomass models with satellite data—can be applied in other cities to support afforestation strategies aligned with local climate goals and air quality standards.
Journal Reference:
Luxi Wang, Xuan Wang, Xiaoxiu Lun, Qiang Wang, Yanshan Gao, ‘Assessing carbon stock and BVOCs emissions from dominant tree species in Beijing’, Journal of Environmental Sciences 156, 1-13 (2025). DOI: 10.1016/j.jes.2024.06.020
Article Source:
Press Release/Material by Journal of Environmental Sciences (Editorial Office)
Dissolved carbon storage and flux dynamics in China’s inland waters over the past 30 years
This study was led by Professor Yang Gao and PhD candidate Shuoyue Wang from the Institute of Geographic Sciences and Natural Resources Research, Chinese Academy of Sciences (CAS). Collaborators include Professor Gaboury Benoit and Professor Peter A. Raymond (Yale University, USA), Academician Guirui Yu (Institute of Geographic Sciences and Natural Resources Research, CAS), Professor Feng Zhou (Peking University), Associate Professor Shaoda Liu and Professor Chiyuan Miao (Beijing Normal University), among others.
The researchers quantified changes in dissolved carbon storage in China’s lakes and reservoirs and dissolved carbon fluxes in rivers over the past 30 years by integrating multi-source data including long-term field observation data from the research group, literature-collected data, and national water quality monitoring site data, combined with methods such as machine learning models and empirical models. It systematically revealed that climate change, anthropogenic disturbances, and water chemistry factors collectively drive the dynamics of dissolved carbon in inland waters.
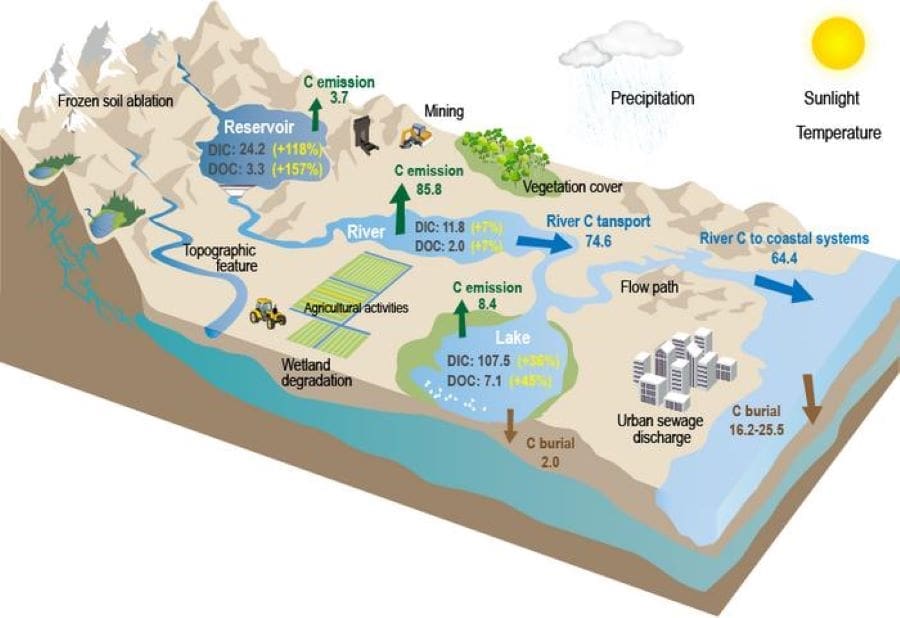
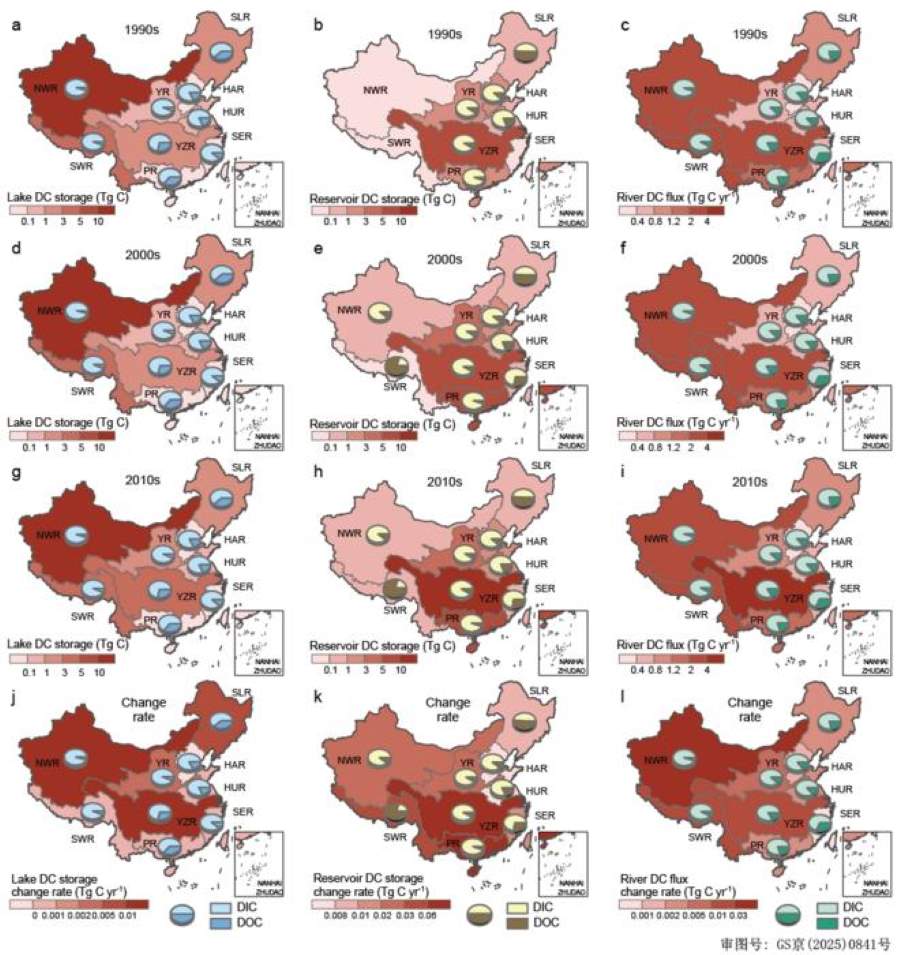
The team found that dissolved carbon storage in China’s lake water bodies increased from 84 Tg C to 115 Tg C over the past 30 years, with significant regional differences. Among them, the Northwest Rivers Basin and the Southeast Rivers Basin had the highest dissolved inorganic carbon (DIC) storage in lake water bodies, while the Northwest Rivers Basin, Songliao River Basin, and Yangtze River Basin had relatively higher dissolved organic carbon (DOC) storage in lake water bodies.
Reservoir dissolved carbon storage doubled due to reservoir capacity expansion. The Yangtze River Basin and Pearl River Basin had the highest reservoir DIC storage, while the Southwest Rivers Basin had the highest reservoir DOC storage. The total dissolved carbon flux in China’s natural rivers increased by only about 7% over the past 30 years, with significant spatial heterogeneity. The Yangtze River Basin, Southwest Rivers Basin, and Northwest Rivers Basin had the highest river DIC fluxes, while the Yangtze River Basin had the highest river DOC flux.
The researchers also found that carbon dynamics in China’s inland waters over the past 30 years were synergistically driven by climatic factors (temperature and precipitation), anthropogenic factors (agricultural and urban land use), and water chemistry factors (water temperature, electrical conductivity, pH, total phosphorus, etc.). Among them, climate and anthropogenic disturbances mainly influenced river dissolved carbon flux changes by affecting hydrological connectivity and terrestrial carbon export, while water chemistry factors directly regulated dissolved carbon storage in lake and reservoir water bodies.
The research findings emphasize the critical role of inland waters in the global carbon balance and point out that under the background of global change, there is an urgent need to strengthen the accurate assessment of inland water carbon budgets to scientifically support carbon emission reduction policies and water quality management practices.
Journal Reference:
Shuoyue Wang, Gaboury Benoit, Peter A Raymond, Guirui Yu, Feng Zhou, Shaoda Liu, Chiyuan Miao, Kun Sun, Zhaoxi Li, Junjie Jia, Yang Gao, ‘Dissolved carbon storage and flux dynamics in China’s inland waters over the past 30 years’, National Science Review nwaf229 (2025). DOI: 10.1093/nsr/nwaf229
Article Source:
Press Release/Material by Science China Press
Old aerial photos give scientists a new tool to predict sea level rise
Researchers from the University of Copenhagen have gained unique insight into the mechanisms behind the collapse of Antarctic ice shelves, which are crucial for sea level rise in the Northern Hemisphere. The discovery of old aerial photos has provided an unparalleled dataset that can improve predictions of sea level rise and how we should prioritise coastal protection and other forms of climate adaptation.
On 28 November 1966, an American aeroplane flies over the Antarctic Peninsula just south of the southernmost tip of Chile.
On board is a photographer, probably from the US Navy, whose job is to map the Antarctic landscape. But it turns out that the photographer is also documenting a very special situation that is in progress. He shoots an aerial photo of the Wordie Ice Shelf, which, 30 years later, has almost vanished after a total collapse.
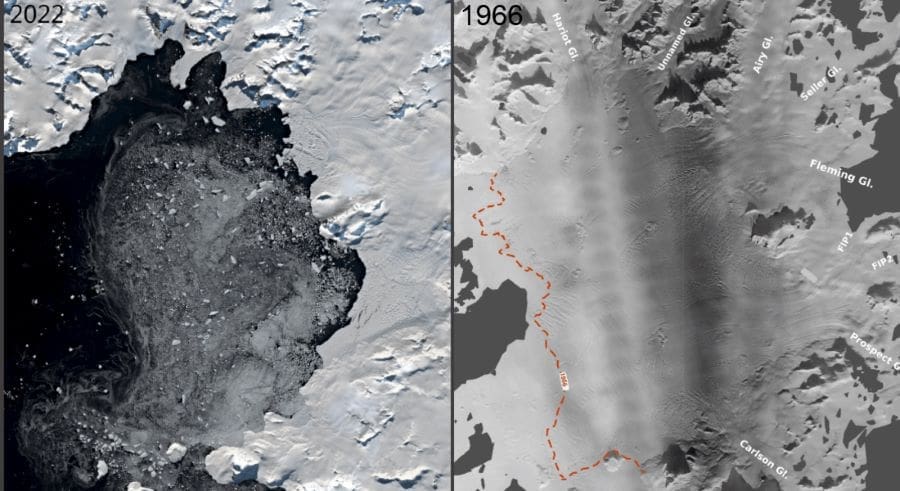
The consequence of this collapse was that the ‘plug’ that held large amounts of glacier ice broke off, leaving the ice sheet floating freely into the sea.
Fortunately, Wordie is a relatively small ice shelf and the sea level rise it has caused can be measured in millimetres. But there are much larger ice shelves in Antarctica, which, like Wordie, could collapse due to climate change. Just the two largest ice shelves, Ronne and Ross, are believed to hold enough ice to account for sea level rises of up to five metres.
If, in this context, we think that Antarctica is far away, we need to understand that the melting of ice in the Southern Hemisphere will cause sea levels to rise in places like Denmark in the Northern Hemisphere, due to the effects of gravity. A new research study provides insights that can help identify signs of incipient collapse in these ice shelves and assess the stage of collapse.
The photo of Wordie from 28 November 1966 – the first in a long series of images that continually document the collapse of the Wordie Ice Shelf through the 1960s – has become a valuable first data point in a study of the ice shelf collapse recently completed by researchers at the University of Copenhagen.
In their paper, now published in Nature Communications, they present a unique dataset based on the vast archives of old aerial images combined with modern satellite observations, which, for the first time, shows the collapse of an ice shelf as a constant evolution in a long time series. A critical insight that can be used to improve scientists’ understanding of ice shelves and the mechanisms behind their collapse.
“We have identified several signs of incipient ice shelf collapse that we expect will be observed in other ice shelves, but perhaps more importantly, the dataset has given us a multitude of pinning points that can reveal how far advanced a collapse is. It’s a completely new tool that we can use to do reality checks on ice shelves that are at risk of collapsing or already in the process of collapsing,” says Postdoc Mads Dømgaard from the Department of Geosciences and Natural Resource Management, who is lead author of the study.
According to the researchers, this knowledge will enhance computer models of sea level rise and lead to more accurate predictions of when the water will rise, allowing for prioritisation of investments in climate change adaptation in the most effective way.
Warmer seawater and melting under the ice were most conclusive
The hundreds of historical aerial photos were analysed using a technique known as structure-from-motion photogrammetry. The method has enabled scientists to accurately reconstruct ice thickness, as well as its extent, surface structure and flow velocity, dating back to the 1960s.
In this way, the researchers analysed the collapse of Wordie and learned more about the factors involved. It was previously assumed that a warmer atmosphere was the primary factor leading to the collapse, and, similarly, that the formation of meltwater lakes on the ice surface had also played a part. The new study has disproved both assumptions.
Instead, the researchers highlight melting under the ice where the sea and ice meet as definitive factors.
“Our findings show that the primary driver of Wordie’s collapse is rising sea temperatures, which have generated the melting beneath the floating ice shelf,” Mads Dømgaard says.
Collapse is tougher than we thought – like it or not
Furthermore, the study’s findings have already altered the foundation of scientists’ knowledge about ice shelf collapse. According to co-author Anders Anker Bjørk, the new data advances our understanding of how and at what speed these collapses occur.
“The tentative conclusion from our findings is that ice shelf collapse may be slower than we thought. This means that the risk of a very rapid development of violent sea level rise from melting in Antarctica is slightly lower, based on knowledge from studies like this one,” says Anders Anker Bjørk, Assistant Professor at the Department of Geosciences and Natural Resource Management.
But there is also a flip side to this, he explains: “It was already a supertanker that needed to be turned to stall the melting of ice in Antarctica, but our data shows a collapse process that is even more protracted than previously assumed. And this longer process will make it harder to reverse the trend once it has started. This is an unambiguous signal to prioritise halting greenhouse gas emissions now rather than sometime in the future,” Anders Anker Bjørk says.
Journal Reference:
Dømgaard, M., Millan, R., Andersen, J.K. et al., ‘Half a century of dynamic instability following the ocean-driven break-up of Wordie Ice Shelf’, Nature Communications 16, 4016 (2025). DOI: 10.1038/s41467-025-59293-1
Article Source:
Press Release/Material by Faculty of Science | University of Copenhagen
Ships trigger high and unexpected emissions of the greenhouse gas methane
The researchers in a study, led by Chalmers University of Technology in Sweden, observed twenty times higher methane emissions in the shipping lane compared to nearby undisturbed areas. Despite the fact that methane is a greenhouse gas that is 27 times as powerful as carbon dioxide, these emissions are often overlooked with today’s measurement methods.
“Our measurements show that ship passages trigger clear pulses of high methane fluxes from the water to the atmosphere. This is caused by pressure changes and mixing of the water mass. Even if the pulses are short, the total amount during a day is significant,” says Amanda Nylund, researcher at Chalmers University of Technology and the Swedish Meteorological and Hydrological Institute, SMHI.
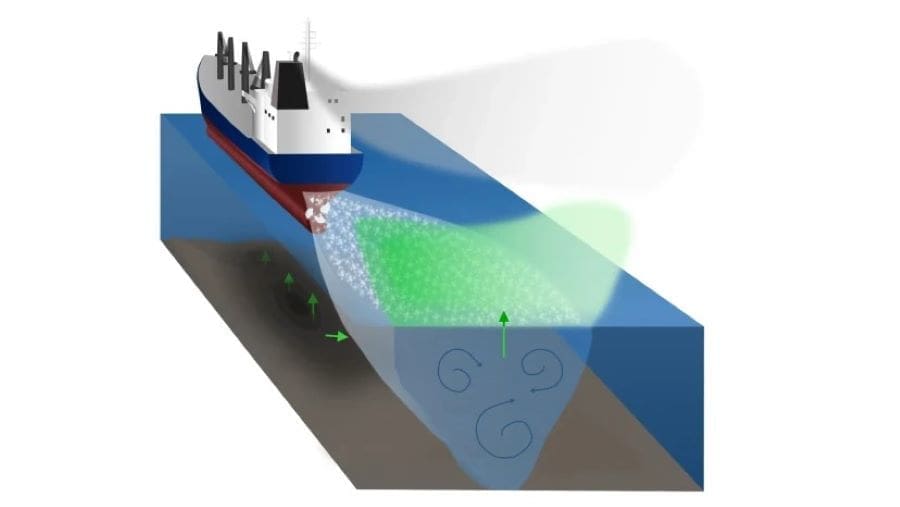
Methane is a potent greenhouse gas and the concern about methane emissions from the few ships that run on liquefied natural gas (LNG) is a very hot topic. In the current study, the measured methane emissions are completely decoupled from the ships’ choice of fuel. This means that all ships can cause emissions and thus shipping’s contribution to emissions of greenhouse gases has previously been underestimated. The researchers point out that even though methane is found naturally in the sediments, the activity of the ships cause an extensive release into the atmosphere.
The study focuses on shallow marine areas where the sediments are oxygen-free and rich in organic matter. In such environments, methane is formed, and at high production levels, the gas can leak or bubble up into the water above. When a ship passes, the pressure at the seafloor changes and methane bubbles make their way out of the sediments more easily. In combination with the mixing that takes place in the wake of ships, the methane can quickly rise to the surface and escape out into the atmosphere.
The phenomenon was discovered by chance
The article, published in Communications Earth & Environment, is unique in its kind and the result of a broad research collaboration. The phenomenon of the extensive methane emissions in shallow waters was first discovered by chance, in connection with other measurements in the Neva Bay in the Baltic Sea.
“The discovery of the hitherto unknown impact of ships is important for improving global estimates of methane emissions, not least considering that nine of the world’s ten largest ports are located in waters with similar conditions as Neva Bay,” says Johan Mellqvist, Professor of Optical Remote Sensing, Chalmers, whose group made the unexpected discovery that forms the basis for the new results.
Two of the largest ship types, cruise and container ships, triggered the most frequent and largest measured methane releases, but slightly smaller ropax vessels (combined freight and passenger ferries) also account for large methane releases. The larger (compared to ropax and container) vessel type, bulk carriers, accounted for lower emissions. This means that it is more complicated than the size of the ships controlling methane emissions.
“A possible explanation for the high emissions of ropax vessels is that they have double propellers,” says Rickard Bensow, Professor of Hydrodynamics, Chalmers, and responsible for the study’s modelling of ship traffic.
Will investigate discharges in large shallow ports
The authors of the current study now emphasise the need to rethink how and where methane measurements are carried out, especially in coastal waters where natural and human factors interact. They place particular focus on further investigating large ports in river deltas.
“The next step is to estimate how large these effects can be globally. Major ports in China, Singapore, and South Korea, as well as European ports such as Rotterdam, Antwerp, and river systems in Germany, have similar conditions to the Neva Bay. It is very likely that we underestimate methane emissions there as well,” says Ida-Maja Hassellöv, Professor of Maritime Environmental Science, Chalmers, who will lead the follow-up project that will start this autumn.
Journal Reference:
Nylund, A.T., Mellqvist, J., Conde, V. et al., ‘Coastal methane emissions triggered by ship passages’, Communications Earth & Environment 6, 380 (2025). DOI: 10.1038/s43247-025-02344-8
Article Source:
Press Release/Material by Chalmers University of Technology
Featured image credit: Gerd Altmann | Pixabay


