Summary:
As climate change intensifies, understanding how societies will cope with future risks is increasingly important. A study published in Scientific Data presents long-term projections of global climate vulnerability, offering one of the most detailed assessments of socioeconomic resilience and fragility worldwide.
The research, led by Climate Analytics in Berlin and Radboud University’s Global Data Lab, builds on the Global Data Lab Vulnerability Index (GVI), which measures how societies respond to climate hazards. Unlike assessments focused mainly on physical exposure, the GVI incorporates seven dimensions of vulnerability, including health, education, economy, gender, and infrastructure. This multidimensional approach provides a clearer picture of which populations may be least prepared to handle climate shocks.
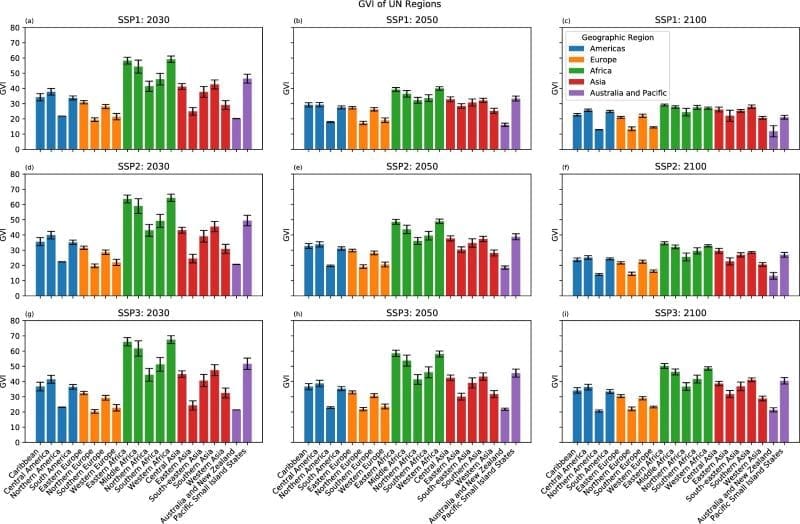
Using data from the Shared Socioeconomic Pathways (SSPs), the researchers developed projections for nearly every country from 2020 to 2100 under three scenarios: a sustainable “green road,” a “middle of the road,” and a “rocky road” dependent on fossil fuels. These scenarios reveal how different development trajectories shape future vulnerability.
The index highlights inequalities, such as those faced by the Vulnerable Twenty (V20) nations, which emit little carbon but bear disproportionate risks. The GVI database is publicly accessible, offering policymakers and researchers a valuable tool for planning effective adaptation strategies.

Global climate vulnerability mapped: These socio-economic factors play a role
The work builds on the Global Data Lab Vulnerability Index (GVI), introduced last year. The GVI moves beyond conventional approaches that primarily assess exposure to physical climate hazards, integrating seven socioeconomic dimensions of vulnerability, including the economy, education, health, gender and infrastructure, to provide a more complete picture of the human and societal dimensions of vulnerability.
“The GVI quantifies how societies are likely to respond to climate hazards,” explains Dr. Janine Huisman, researcher at Radboud University and first author of the study. “By highlighting the human components of vulnerability, the index provides crucial insight into which communities may be least prepared for climate impacts.”
“Countries with a higher proportion of well-educated and healthy citizens can better anticipate and adapt to the changes required,” Huisman notes. “Likewise, better infrastructure enables faster and more effective disaster response.”
Socioeconomic vulnerability into the future
To capture long-term dynamics, the research team modeled vulnerability under three future climate scenarios, ranging from continued reliance on fossil fuels to a full transition to renewable energy. Dr. Rosanne Martyr, senior scientist at Climate Analytics, and paper co-author, adds: “This allows policymakers and scholars to assess whether countries remain vulnerable under traditional energy use patterns, or whether vulnerabilities persist even in a rapid transition to renewable energy.”
The project was initiated at the request of the Vulnerable Twenty (V20) group of nations, which collectively represent 20 percent of the global population yet account for only 5 percent of carbon emissions. The GVI helps illuminate why these nations face disproportionate risks under varying climate futures.
Subnational vulnerability
Recognizing that vulnerability is not evenly distributed within countries, a next step will be to extend the GVI to the subnational level. Prof. Jeroen Smits of Radboud University and also co-author, adds: “Because vulnerability levels vary greatly within countries, this finer-grained perspective will enable far more targeted and effective adaptation strategies.”
The GVI is freely accessible via the Global Data Lab website, making it a valuable resource for researchers, policymakers, and international organizations. “We hope the index will become a central tool in global climate assessments, guiding interventions to where they are most urgently needed,” Smits concludes.
Journal Reference:
Huisman, J., Martyr, R., Rott, R. et al., ‘Projections of climate change vulnerability along the Shared Socioeconomic Pathways 2020–2100’, Scientific Data 12, 1527 (2025). DOI: 10.1038/s41597-025-05732-z
Article Source:
Press Release/Material by Radboud University
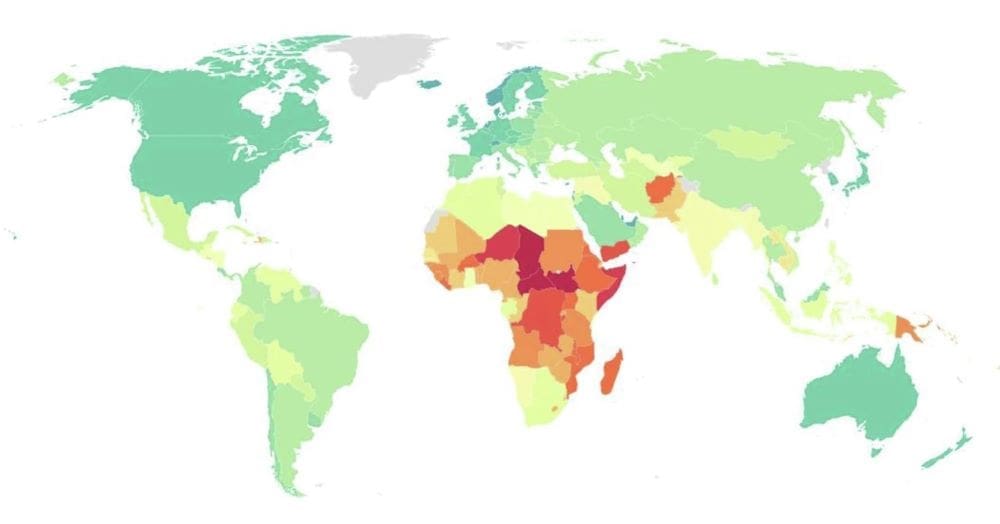
Featured image : Map of GVI for 2020. Colors indicate country-level (national) values. Higher values (red, orange) indicate higher levels of vulnerability (cropped, Fig. 1). Credit: Huisman et al. (2025) | Scientific Data | CC BY-NC-ND


