Explore the latest insights from top science journals in the Muser Press daily roundup, featuring impactful research on climate change challenges.
In brief:
Some insects are declining but what’s happening to the other 99%?
Insects are the dominant form of animal life on our planet, providing humans and wildlife with pollination, food, and recycling services but, despite concerns about population declines, little is known about how 99% of species globally are faring.
A new approach is needed to better monitor species and protect them from the impacts of climate and land use change, pollution and invasive non-native species as soon as possible, according to a study led by the UK Centre for Ecology & Hydrology (UKCEH) and ZSL (Zoological Society of London).
The researchers, whose work has been published in the journal Science, point out there are one million known insect species globally but there have been IUCN assessments for just 1% – 12,100 species, with around 20% of these considered threatened.

Monitoring is largely confined to butterflies, bumblebees and dragonflies in parts of Europe and North America, with little known about insects in parts of Asia and South America and virtually no data on species in Africa.
Incomplete picture
Despite reports of catastrophic insect declines, the study authors say the global state of insect biodiversity remains unclear due to the sheer complexity of insects’ lifestyles and fluctuating population trends, as well as a massive lack of data.
In their study, they propose a new framework for monitoring populations and analysing the impact of threats that integrates all available methods for studying insects. These are: comparing diversity and abundance over time and across different habitats, and through gathering expert opinion and carrying out experiments.
Dr Rob Cooke, an ecological modeller at UKCEH and joint lead author of the study, explained: “We need to find out whether insect declines are widespread and what’s causing them. The challenge is like a giant jigsaw puzzle where there are thousands of missing pieces, but we do not have decades to wait to fill these gaps and then act.
“There is a lot of interest in monitoring charismatic species such as bees and butterflies, but few people care about the supposedly unpleasant insects, even though they too provide benefits for us. For example, earwigs feed on aphids and other garden pests while cockroaches eat decaying material and keep soils healthy.”
Undervalued and understudied
Dr Charlotte Outhwaite of ZSL’s Institute of Zoology, joint lead author of the study, added: “Insects are an incredibly important part of our ecosystems, pollinating around 80% of flowering plant species and vital for 35% of global food production, yet they are undervalued and understudied.
“With a million described species it would take too long to figure what works best for each species. Instead we want to find large-scale actions that benefit the most insects. For this, we need to use all the available information we have.”
The study authors explain this means that, when there is a lack of data, experts would make judgments about how climate, land use, pollution or invasive non-native species are affecting certain species based on the known impacts on similar types of insects. Their proposed framework would integrate four types of research methods:
- Time series trends, for example a decline in the number of butterflies over a 10-year period.
- Spatial comparisons, such as looking at differences in species numbers or abundance across different habitats or regions.
- Experiments to investigate the response of insects to different threats, such as comparing a field sprayed with pesticides to one without, or removing invasive non-native species from one area but not another.
- Expert opinion on the response of insects to threats, for example, a scientist pointing out that butterfly counts tend to be higher in warmer rather than colder forests.
By combining data from a range of sources, scientists can gain a more complete picture of how insects respond to drivers of change while allowing transparency in uncertainty and data gaps.
The next step for the researchers is to implement their approach by using the range of research methods to model insect responses to key threats. Consolidating all available data will provide an updated overview of the state of the world’s insect populations.
The work is part of a project funded by the Natural Environment Research Council (NERC), which is bringing together diverse sources of data including expert knowledge to assess the impact of individual threats.
The Global Insect Threat-Response Synthesis (GLiTRS) project involves UKCEH, the Natural History Museum, University College London, the Zoological Society of London, the University of Cambridge, Queen Mary University of London, the University of Stellenbosch, the University of Reading, the University of Exeter and Imperial College London.
Journal Reference:
Rob Cooke et al., ‘Integrating multiple evidence streams to understand insect biodiversity change’, Science 388, eadq2110 (2025). DOI: 10.1126/science.adq2110
Article Source:
Press Release/Material by UK Centre for Ecology & Hydrology
Climate change and prehistoric human populations: Eastward shift of settlement areas at the end of the last ice age
A new study sheds light on how prehistoric hunter-gatherer populations in Europe coped with climate changes over 12,000 years ago. Led by scientists from the University of Cologne, a team of 25 prehistoric archaeologists from twenty European universities and research institutions revealed significant shifts in population size and density during key periods at the end of the last Ice Age, specifically during the Final Palaeolithic between 14,000 and 11,600 years ago.
The study has been published in PLOS One under the title ‘Large scale and regional demographic responses to climatic changes in Europe during the Final Palaeolithic’.

The results reveal that the first establishment of a larger human population in north-eastern central Europe during the Final Palaeolithic was followed by a dramatic population decline during the last cold period (Greenland Stadial 1) of the Ice Age.
This decline reduced the total population of Europe by half. However, the study found that some areas in central Europe show stability or even a slight increase in population size against the general trend. The team interprets this finding as evidence of human migration towards the east in response to worsening climate conditions.
By compiling a comprehensive database on archaeological sites from this period and using a cutting-edge geostatistical method called the Cologne Protocol, the researchers estimated population sizes and densities of prehistoric humans across different regions of Europe.
The protocol provides a standardised procedure to estimate prehistoric demographic data, allowing for diachronic comparisons. The identified shifts in regional population sizes provide new insights into how early humans responded to the environmental challenges of their time.
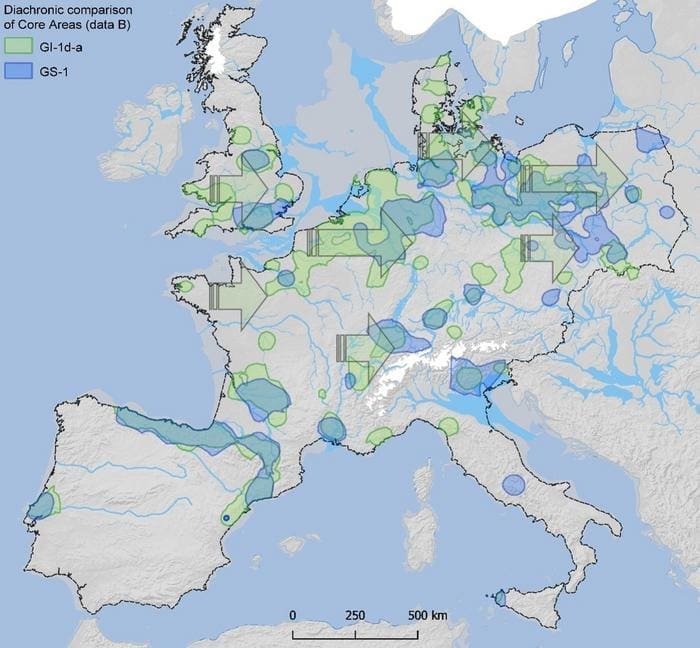
The study focuses on two key periods: Greenland Interstadial 1d-a (GI-1d-a) and Greenland Stadial 1 (GS-1). During GI-1d-a, a warmer period of the Final Palaeolithic, humans continued to repopulate and expand into northern and north-eastern central Europe, making this region the centre of demographic dynamics in Europe for the first time in prehistory. Populations in south-western Europe, particularly in Spain and France, began to decline compared to population estimates for the preceding periods of the Upper Palaeolithic.
When the climate turned much colder during the subsequent GS-1, a climatic period known in the northern Hemisphere as the ‘Younger Dryas’, the total population of Europe decreases by half. But the new study shows that regional dynamics varied considerably: The estimates indicate an increase in population density in some areas of Europe (e.g. northern Italy, Poland and north-eastern Germany) as well as a general shift of populated areas from west to east.
“These observations probably reflect the eastward movement of people in response to the very abrupt and pronounced climatic cooling during the Younger Dryas,” explains Dr Isabell Schmidt from the University of Cologne’s Department of Prehistoric Archaeology. “Humans during the Final Palaeolithic apparently responded by migrating to more favourable areas.”
The Cologne researchers are familiar with extreme population declines in Prehistory, such as during the late Gravettian (29,000 to 25,000 years ago), when cooler temperatures reduced populations in western and central Europe by up to two-thirds, leading to the extinction of regional populations.
Although demographic dynamics, particularly in these early phases of human prehistory, are still poorly understood, the new study adds to a growing body of evidence on how prehistoric humans responded to climate change, investigated at the University of Cologne in the framework of the Collaborative Research Centre 806 – Our Way to Europe, which was funded by the German Research Foundation (DFG) from 2009 to 2021.
This work is currently being continued by the project HESCOR (Human and Earth System Coupling Research) at the University of Cologne, funded by the Ministry of Culture and Science of the State of North Rhine-Westphalia.
Journal Reference:
Schmidt I, Gehlen B, Winkler K, Arrizabalaga A, Arts N, Bicho N, et al., ‘Large scale and regional demographic responses to climatic changes in Europe during the Final Palaeolithic’, PLoS ONE 20 (4): e0310942 (2025). DOI: 10.1371/journal.pone.0310942
Article Source:
Press Release/Material by University of Cologne
Bar-Ilan University researchers develop AI model to predict lightning-induced wildfires with unprecedented accuracy
The new AI model can predict where and when lightning strikes are most likely to cause wildfires, achieving over 90% accuracy — a first in wildfire forecasting.
Dr. Oren Glickman and Dr. Assaf Shmuel from the Department of Computer Science at Bar-Ilan University, in collaboration with experts from Ariel and Tel Aviv Universities, utilized seven years of high-resolution global satellite data, alongside detailed environmental factors like vegetation, weather patterns, and topography, to map and predict lightning-induced wildfire risks on a global scale.
Their research was recently published in Scientific Reports.
What makes the research by Dr. Glickman, Dr. Shmuel, and their colleagues so significant is their ability to predict lightning-induced wildfires with remarkable precision. The AI model outperforms traditional fire danger indices by taking a global, data-driven approach. It integrates data from satellites, weather systems, and environmental factors to assess the likelihood of lightning-induced fires, overcoming the limitations of regional and data-restricted models.

The model was rigorously tested using wildfire data from 2021 and showed an unprecedented accuracy rate of over 90%, a level of precision that could transform emergency response and disaster management worldwide.
As climate change accelerates, extreme weather events — such as lightning storms, hot and dry conditions, and shifting ecosystems — are contributing to more frequent and intense wildfires. While human activity is often responsible for igniting many fires, lightning remains one of the most unpredictable and deadly causes, particularly in remote regions. These fires can smolder undetected for days, only to erupt into uncontrollable infernos before firefighters can respond. The catastrophic wildfires that ravaged Northern California in August 2020 were sparked by lightning strikes, burning more than 1.5 million acres and claiming dozens of lives.
With an improved ability to predict lightning fires, meteorological services, fire departments, and emergency planners can respond earlier, smarter, and more effectively — potentially saving lives and protecting ecosystems. This model also addresses a key gap in existing wildfire prediction models: while many models are effective for fires caused by human activity, they struggle to predict lightning-induced fires, which behave very differently and often start in hard-to-reach areas.
While the AI model is not yet integrated into real-time forecasting systems, its development marks a critical step forward in wildfire prediction. As Dr. Shmuel notes: “With the growing implications of climate change, new modeling tools are required to better understand and predict its impacts; machine learning holds significant potential to enhance these efforts.”
The new machine learning models developed by the team have the potential to predict lightning-ignited wildfires worldwide, offering a powerful tool for fire mitigation and response. With an ever-increasing risk of wildfires driven by climate change, early detection and prediction are essential for protecting forests, wildlife, and human communities from the devastating effects of these fires.
“We are at a critical moment in understanding the complexities of wildfire ignitions,” said Dr. Glickman, from Bar-Ilan University’s Department of Computer Science. “Machine learning offers the potential to revolutionize how we predict and respond to lightning-ignited wildfires, providing insights that could save lives and preserve ecosystems.”
Journal Reference:
Shmuel, A., Lazebnik, T., Glickman, O. et al., ‘Global lightning-ignited wildfires prediction and climate change projections based on explainable machine learning models’, Scientific Reports 15, 7898 (2025). DOI: 10.1038/s41598-025-92171-w
Article Source:
Press Release/Material by Bar-Ilan University
Enhanced westerly winds lead to increased ocean heat transport to the East Antarctic Ice Sheet
A research group led by Associate Professor Kohei Mizobata, Tokyo University of Marine Science and Technology (TUMSAT); the National Institute of Polar Research; the Japan Agency for Marine-Earth Science and Technology; and the Institute of Low Temperature Science, Hokkaido University, has found that enhanced westerly winds associated with global warming will strengthen the clockwise circulations and heat transport to the ice sheet in the East Antarctic coastal area.
Loss of the Antarctic ice sheet has traditionally been cited as one of the main causes of global mean sea-level rise. Melting due to the inflow of warm seawater from the open ocean has been especially highlighted as a factor contributing to the loss of the Antarctic ice sheet. On the other hand, an understanding of the response of the Antarctic ice sheet to ongoing global warming has been desired.
Using originally developed satellite-derived dynamic ocean topography data and atmospheric reanalysis data, this research group not only clarified that clockwise circulations transporting warm seawater to the Antarctic ice sheet are scattered in the East Antarctic coastal region but also revealed that the strengthening of westerly winds enhances these oceanic circulations and associated heat transport through statistical analysis.
Based on the results of this study, enhanced ocean circulation and heat transport in the East Antarctic coastal region and accelerated ice sheet melting are expected to occur due to global warming. The findings of this study are also expected to help improve the accuracy of future projections of sea level rise.

Background
About 90% of the ice on Earth is located in Antarctica; if all this ice were to melt, the global sea level would rise by more than 50 meters. In addition, the ice sheets in West Antarctica and East Antarctica could be eroded by seawater to the equivalent of 3.4 m and 19.2 m of global sea level rise, respectively. Melting of the Antarctic ice sheet has been reported mainly in West Antarctica, but recently warm seawater melting in Totten Glacier, one of the largest glaciers in East Antarctica, has begun to be noted (Rintoul et al., 2016).
Future projections based on global warming scenarios indicate that sea level will rise by 0.82 m by the end of the 21st century compared to the end of the 20th century, with a rise in sea level of 0.03 to 0.34 m due to the melting of the Antarctic ice sheet. The main reason for the uncertainty in this future projection is that there are many unknowns regarding the “response of the Antarctic ice sheet to global warming.”

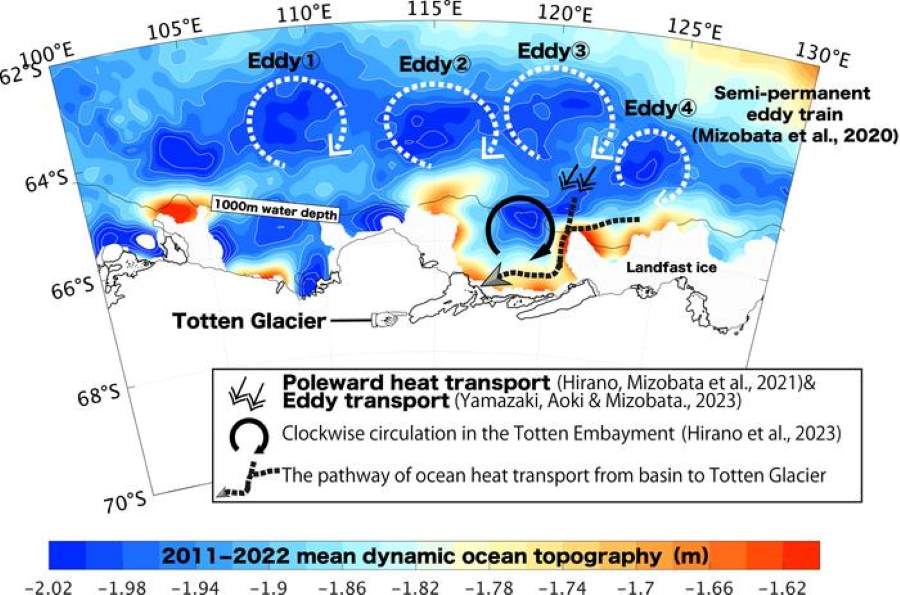
The research group has intensively conducted in situ observations in the Totten embayment, with a particular focus on the transport pathways of warm seawater that cause the melting of the Antarctic ice sheet. As a result, it has become clear that warm seawater transported southward (toward Antarctica) by semi-permanent oceanic eddies in the distant open ocean basin is further transported below Totten Glacier by clockwise circulation in the Totten embayment (Fig. 1) (Hirano et al., 2023). However, the “time-varying mechanism of ocean circulation,” which is the cause of variation in the amount of ice sheet melting, is still unknown, and its elucidation has been an urgent issue.
Given this circumstance, we have integrated satellite observation data, atmospheric reanalysis data, and in situ observation data under the Phase X Priority Research and Observation Project of the Antarctic Regional Observation, and attempted to clarify ocean circulation and its variability in the entire coastal region of East Antarctica, where not only Totten Glacier but also enormous ice sheets exist.
Results
One of the most important pieces of information for understanding ocean circulation is the spatial distribution of sea-surface height as determined by Earth observing satellites. Normally, sea ice in the Antarctic and Arctic Oceans is an obstacle to the estimation of sea-surface height.
We developed a method to obtain sea-surface height information even in sea-ice areas, by extracting only the signal from the sea surface and eliminating the signal from sea ice based on the pulse waveform of the satellite radar altimeter data. Next, by synthesizing sea-surface height information in sea ice-free waters, a new dynamic ocean topography data set was constructed for the period from January 2011 to December 2022.
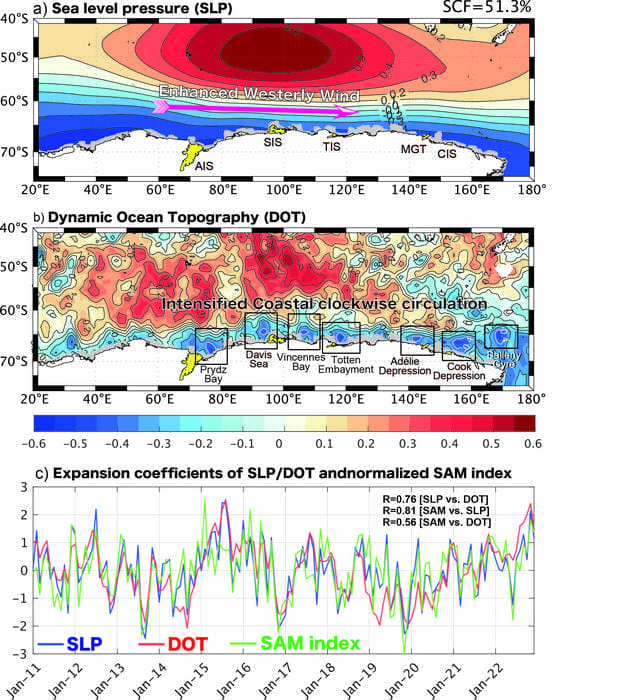
The dynamic ocean topography data revealed the existence of a clockwise circulation not only in the waters around Totten Glacier, but also in Prydz Bay and Vincennes Bay, and that the sea surface dynamic height fluctuates in tandem despite the spatial distance between the two areas. These results suggest that changes in the atmospheric field dominate changes in the oceans. Furthermore, we have performed a singular value decomposition analysis on the dynamic ocean topography data and the sea level pressure data provided by the European Centre for Medium-Range Weather Forecasts.
This statistical analysis allows us to extract the spatio-temporal structure of the high correlation between the two physical quantities (in this case, dynamic ocean topography and sea level pressure). The results show that enhanced westerly winds in East Antarctica strengthen the clockwise circulation not only in the bays mentioned above, but also in many East Antarctic coastal areas such as Davis Sea and the Adélie Depression (Fig. 2).
Variations in westerly wind intensity alter not only the clockwise circulation but also the amount of ocean heat transport to the East Antarctic Ice Sheet. The strength of the westerly wind is expressed by the Southern Annular Mode Index (SAM index; Marshall, 2003). The average ocean heat transport in the Totten Embayment was calculated for negative and positive SAM index period, and the difference was found to be 0.1 tera Watts (10 gigatons of ice sheet melt, or about 17% of the average melt).
Future Perspective
Future projections based on global warming scenarios indicate that westerly winds will strengthen until the latter half of the 21st century. The results of this study point to enhanced ice sheet melting in the East Antarctic coastal region via enhanced ocean circulation under global warming. The findings of this study will contribute not only to a comprehensive understanding of East Antarctic ice sheet fluctuations, but also to improving the accuracy of sea level rise predictions.
Journal Reference:
Mizobata, K., Hirano, D., Kusahara, K., Aoki, S., Inoue, J., Takao, S., & Makabe, R., ‘Ocean response along the east Antarctic coastal margin to the southern annular mode’, Geophysical Research Letters 52, 6, e2024GL112914 (2025). DOI: 10.1029/2024GL112914
Article Source:
Press Release/Material by Hokkaido University
Featured image credit: Gerd Altmann | Pixabay


