Explore the latest insights from top science journals in the Muser Press daily roundup (July 2, 2025), featuring impactful research on climate change challenges.
In brief:
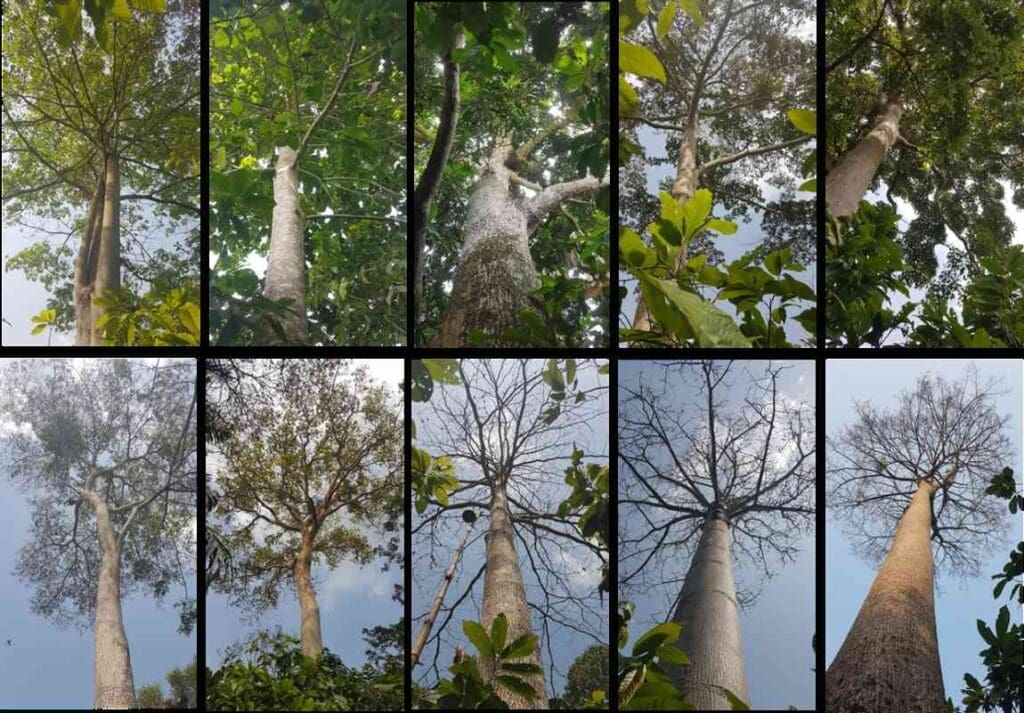
Thunderstorms are a major driver of tree death in tropical forests
Trees in tropical forests are dying at an increased rate, with consequences for biodiversity, carbon storage, and the global climate. While deforestation is the primary cause of forest loss, intact forests are also experiencing a rise in tree death. Drought, higher temperatures, and fires have been the leading suspects, but a new paper led by Evan Gora, a forest ecologist at Cary Institute of Ecosystem Studies, identifies an underappreciated threat: thunderstorms, which are becoming more frequent with climate change.
Not to be confused with hurricanes or cyclones, these convective storms tend to be short-lived but powerful, with tree-toppling winds and lightning. In a perspective paper in Ecology Letters, Gora and colleagues lay out the case for why such storms could be a major driving force behind the rising death toll of tropical trees. As they become more common in the warming tropics, thunderstorms are a growing threat to trees and the carbon they store.

“Tropical forests have massive effects on global climate. They’re like the lungs of the Earth, and we’re seeing trees in them dying at higher rates than in the past, and the composition of forests is changing, too,” said Gora. “That could be really problematic for the future of not just tropical forests, but for the planet.”
Understanding what’s causing the trends in tree death is critical to guiding decisions about which tree species to plant or conserve in a forest, so that forest managers can ensure forests continue thriving and storing carbon long into the future.
“Being in the forest during a tropical storm is unforgettable,” said coauthor Vanessa Rubio, a forest ecologist in Gora’s lab at Cary Institute. “As the storm quickly builds, the sky darkens, humidity changes drastically, and strong winds shake the trees. Then, thunder and lightning come. Leaves and branches fall to the ground, rain pours down, and your instinct is to get back to the field station as quickly as possible.”
Despite their obvious danger to people, storms had been overlooked and understudied as a potential culprit in tree mortality trends. But when the team reanalyzed data from previous studies on tropical forest carbon stocks, they found that storms were at least as good as drought and temperature in explaining the patterns of tree mortality and forest carbon storage.
“We were surprised to find that storms may be the largest single factor causing tree death in these forests, and they’re largely overlooked by research into carbon storage in the tropics,” said Gora. “Our estimates suggest that storms are responsible for 30 to 60% of tree mortality in the past, and that number must be increasing as storm activity increases by 5 to 25% each decade.”
The team also added storms to the largest plot-based study of forest biomass carbon dynamics to date. That study had previously concluded that when temperatures go above a certain threshold, tropical forests experience a fast decline in carbon stocks. “But when you add storms, that relationship goes away,” said Gora. “It basically shows that you have to include storms, or you might not get the answers right.”
Storms and droughts are not mutually exclusive, the scientists note – the same forests can experience both high storm activity and drought stress. They found high convective storm activity across the southern Amazon, where water stress is also high and patterns of change are among the most extreme.

“During my studies on threats to tropical forests, my professors, our textbooks, and even overall climate policy never mentioned small, convective storms as a potential source of forest mortality,” said coauthor Ian McGregor, a Cary Institute forest ecologist in Gora’s lab. “I don’t remember seeing them in global climate models used to inform climate policy. Given our findings, however, it’s clear we need a more thorough understanding of these storms to have more accurate climate models, and thus more effective policy.”
There are good reasons why scientists have overlooked storms until now. Temperature and water stress can be monitored with meteorological stations and readily connected to long-term forest plot data. It is much harder to detect storms and track their highly localized damage. Mortality caused by thunderstorms is not easily detected via satellite, and it’s not practical for researchers on foot to survey large forested areas frequently enough to pinpoint the damage caused by a specific storm.
Gigante, a project led by Gora and co-author Adriane Esquivel-Muelbert from the University of Birmingham, offers one way to overcome these challenges. The project combines a lightning location system, drone scouts, and on-the-ground experts to sample large areas of tropical forest frequently. With these tools, they are starting to quantify when, where, and why tropical trees are dying, and which species are most affected.
Understanding current and future threats to tropical forests is crucial to informing long-term conservation and restoration efforts.
“If we make decisions about which species to plant or conserve based on an incorrect understanding of what’s actually killing these trees and which species are most vulnerable, those forests won’t reach their full potential,” said Gora. Storms are most deadly to mature trees, so the consequences of misguided reforestation efforts might not be known until decades after the trees are planted.
“However,” Gora continued, “if we can build a more holistic picture of what’s driving forest change, we can be a lot more confident in guiding forest management practices for long-term sustainability.”
Journal Reference:
Evan M. Gora, Ian R. McGregor, Helene C. Muller-Landau, Jeffrey C. Burchfield, K.C. Cushman, Vanessa E. Rubio, Gisele Biem Mori, Martin J. P. Sullivan, Matthew W. Chmielewski, Adriane Esquivel-Muelbert, ‘Storms are an important driver of change in tropical forests’, Ecology Letters (2025). DOI: 10.1111/ele.70157
Article Source:
Press Release/Material by Cary Institute of Ecosystem Studies
What about tritiated water release from Fukushima? Ocean model simulations provide an objective scientific knowledge on the long-term tritium distribution
Operators have pumped water to cool the nuclear reactors at the Fukushima Daiichi Nuclear Power Plant (FDNPP) since the accident in 2011 and treated this cooling water with the Advanced Liquid Processing System (ALPS), which is a state-of-the-art purification system that removes radioactive materials, except tritium. As part of the water molecule, tritium radionuclide, with a half-life of 12.32 years, is very costly and difficult to remove.
The ALPS-treated water was accumulating and stored at the FDNPP site and there is limited space to store this water. Therefore, in 2021, the Government of Japan announced a policy that included discharging the ALPS-treated water via approximately one kilometre long tunnel into the ocean. Planned releases of the ALPS-treated water diluted with ocean water began in August 2023 and will be completed by 2050.

In a new numerical modeling study, researchers from the Institute of Industrial Science, The University of Tokyo, in collaboration with the Fukushima University have revealed that the simulated increase in tritium concentration in the Pacific Ocean due to the tritium originating from the ALPS-treated water is about 0.1 % or less of than the tritium background concentration of 0.03-0.2 Bq/L in the vicinity of the discharge site (within 25 km) and beyond, which is below detection limits (i.e., so small that the difference due to the presence or absence of ALPS-treated water added to the original seawater cannot be measured).
This is far below the WHO international safety standard of 10,000 Bq/L and consistent with results of tritium concentration monitoring in seawater conducted in conjunction with the discharge of ALPS-treated water.
“Since the government’s announcement in 2021 to discharge the ALPS-treated water, several studies have investigated the radiological impact of ALPS-treated water discharge on tritium concentration in seawater and marine biota, but there were no global ocean simulations with anthropogenic tritium concentration using a realistic discharge scenario and for a period long enough to consider long-term impacts such as global warming,” explains lead author of the study Alexandre Cauquoin. “In our global ocean simulations, we could investigate how ocean circulation changes due to the global warming and representation of fine-scale ocean eddies influence the temporal and spatial distribution of tritium originating from these treated-water releases.”
Climate change and eddies in the water currents speed up the tritium movement through the ocean. However, the researchers found that the concentrations of tritium from ALPS-treated water discharge remain similar and very low. “Our simulations show that the anthropogenic tritium from the discharge of ALPS-treated water would have negligible impact on the tritium concentration in the ocean, both in the short and long term,” says Maksym Gusyev from the Institute of Environmental Radioactivity, Fukushima University.
This study may help in building models to understand how tritium, as tritiated water molecule, moves through water vapor and ocean water. Tritium is useful to trace the dynamics of the water cycle, so climate models able to simulate tritiated water can help studies of precipitation patterns, atmospheric and oceanic circulation, moisture sources, river catchments, and groundwater flow in the future.
Journal Reference:
Alexandre Cauquoin et al., ‘Ocean general circulation model simulations of anthropogenic tritium releases from the Fukushima Daiichi nuclear power plant site’, Marine Pollution Bulletin 220, 118294 (2025). DOI: 10.1016/j.marpolbul.2025.118294
Article Source:
Press Release/Material by Institute of Industrial Science | The University of Tokyo
What we learned from record-breaking 2021 heat wave and what we can expect in the future
The deadly, record-breaking heatwave that hit the Pacific Northwest in June 2021 continues to be the subject of intense interest among scientists, policy makers and the public. A new study from some of the region’s top climate scientists synthesized more than 70 publications addressing the causes and consequences of the extreme heatwave and the potential for similar high-heat events to happen in the future.
“It’s still the event of interest for anyone who studies heatwaves or the atmospheric patterns that cause them,” says Paul Loikith, associate professor of geography in Portland State’s School of Earth, Environment and Society and a co-author of the study.
Researchers in the Pacific Northwest and around the world agreed that the heatwave was caused by a rare and complex combination of meteorological factors. The primary driver was a persistent, extraordinarily strong ridge of high pressure – often called a “heat dome” – that trapped hot air over the region. Other contributing factors included moisture from the tropical Pacific Ocean, high solar radiation, low pressure offshore, sinking air over land and unusually dry soils.

Loikith says there’s no consensus that ridges of high pressure similar to the one that drove this event will become significantly more common, but as the climate continues to warm, the temperatures experienced during the 2021 heat wave, such as 108, 112 and 116 degrees Fahrenheit (n.e. 42.2 °C, 44.4 °C and 46.7 °C) over three consecutive days in Portland, will become more frequent.
“Essentially, you don’t need a high pressure ridge of that magnitude to create a heatwave of that magnitude,” Loikith said. “As you get into a warmer climate, you could have a weaker feature in the atmosphere lead to the same temperatures because the overall background climate is getting hotter.”
He says the likelihood of reaching 116 degrees Fahrenheit in Portland again is increasing over time, but the probability is still fairly low.
“By the end of the 21st century, a heatwave of this magnitude potentially could be experienced once a decade or maybe even more frequently under a higher emissions scenario,” Loikith said.
Whether the region experiences another heatwave of equal magnitude this summer or next summer can’t be predicted more than one or two weeks in advance.
“Portland summers have warmed by a lot over the last 80 years – four, even five degrees Fahrenheit – but the 2021 event was almost 40 degrees Fahrenheit (n.e. 22.2 °C) above average,” Loikith said. “Putting that into context, we’re seeing this steady, gradual warming. We will still have some cooler summers and warmer summers. The cooler summers are warmer than cooler summers were in the past, and the warmer summers are warmer than the warm summers in the past.”
The researchers say that there is still much to learn about the atmospheric drivers and long-term impacts of these extreme weather events.
The 2021 heatwave had compound effects on human health and ecosystems. Mortality, heat-induced illness and the number of visits to emergency departments were anomalously high, with the greatest impact among older adults, individuals living alone, those with lower incomes, and those without working air conditioning. Browning or scorching of tree leaves and needles following the heatwave was extensive, although the extent of long-term tree mortality is not yet clear.
Following the heatwave, Oregon, Washington and British Columbia established new initiatives to reduce the risk of heat-related illness, including workplace regulations and new programs to provide cooling devices to populations at greatest risk, but the researchers anticipate it will be several years before the effectiveness of these new interventions is known.
“This is an example of why we need to study these things so that we can better understand them and better predict what their likelihood is going to be in the future,” Loikith said. “The studies that we reviewed in this paper help us understand things as basic as atmospheric theory, like things that we still don’t fully understand about the atmosphere, all the way to impacts on ecosystems and on people and everything in between. We are still learning, and that’s making us more prepared.”
The study was published in the Bulletin of the American Meteorological Society. Loikith was joined in the study by Oregon State University’s Erica Fleishman, director of the Oregon Climate Change Research Institute and lead author; David Rupp, an associate professor and researcher with OCCRI; Larry O’Neill, Oregon’s state climatologist; and Karen Bumbaco, Washington’s deputy state climatologist.
Journal Reference:
Fleishman, E., D. E. Rupp, P. C. Loikith, K. A. Bumbaco, and L. W. O’Neill, ‘Synthesis of Publications on the Anomalous June 2021 Heat Wave in the Pacific Northwest of the United States and Canada’, Bulletin of the American Meteorological Society 106, E1155–E1174 (2025). DOI: 10.1175/BAMS-D-24-0188.1
Article Source:
Press Release/Material by Portland State University
Signs of rising planetary strain highlight need for accelerated climate targets
In their paper published in Science of the Total Environment, researchers from IIASA and Lviv Polytechnic National University in Ukraine, presented a novel approach to measure and understand human pressure on planet Earth. The researchers explored how carbon emissions can be translated into measures of “stress” and “strain” to derive new insights into how the planet is changing.
“Until now, the scientific community has mainly measured Earth’s condition in gigatons of carbon per year. That’s important, but it doesn’t show how Earth as a physical system responds to the growing pressure we’re putting on it,” explains lead author Matthias Jonas, a researcher in the IIASA Advancing Systems Analysis Program. “We wanted to see how the entire Earth system stretches and strains under that burden.”

One of their key findings is the quantification of “stress power”, which is the rate at which humans are adding energy per volume to Earth’s system. In 2021, this stress power reached between 12.8 and 15.5 pascals per year. While this pressure may sound small (it is similar to the gentle push of a light breeze), spread over the entire atmosphere, land, and oceans, it is enough to signal that Earth’s system might be pushed outside its natural balance. For comparison, both strain and stress power center around zero for a balanced Earth not exposed to human-induced global warming.
The researchers also analyzed changes over time in Earth’s “delay time”, which describes how quickly the planet’s carbon system reacts to stress and identified a turning point between 1925 and 1945, suggesting that Earth’s system began shifting its response to stress much earlier than previously believed.
“This early turning point was unexpected,” says Jonas. “It suggests that Earth’s land and oceans may have started changing from their usual patterns as early as the first half of the 20th century. After that, instead of working as they used to, these systems were increasingly overwhelmed by human activities and eventually stopped absorbing CO2 as effectively.”
This could mean countries need to act sooner than planned to cut greenhouse gas emissions.
“Meeting future emissions targets is important, but we also need to pay attention to how quickly Earth is becoming more fragile,” Jonas says. “Even if we hit our targets, the weakening of Earth’s natural systems could still leave us facing major disruptions sooner than expected. Earth’s shift to earlier fragility isn’t captured in climate models yet, but it needs to be.”
The team emphasizes the need for further research to quantify this shift and include their stress-strain approach in global climate modeling. They hope that by expanding how scientists track Earth’s condition from counting carbon alone to understanding how the planet physically reacts under pressure, the world can better prepare for the challenges ahead.
Journal Reference:
Jonas, M., Bun, R., Ryzha, I., & Żebrowski, P., ‘Human-induced carbon stress power upon Earth: Integrated data set, rheological findings and consequences’, Science of the Total Environment 992, 179922 (2025). DOI: 10.1016/j.scitotenv.2025.179922
Article Source:
Press Release/Material by International Institute for Applied Systems Analysis (IIASA)
New 3D glacier visualizations provide insights into a hotter Earth
As glaciers retreat due to a rise in global temperatures, one study shows detailed 3D elevation models could drastically improve predictions about how they react to Earth’s warming climate.
While only 10% of Earth is covered in glacial ice, these masses have far-reaching impacts on all the world’s ecosystems. Rapid melting can trigger natural disasters, and glaciers help to regulate the planet’s temperature and sea level and are sources of pristine fresh drinking water.
To better differentiate between seasonal ice loss and that caused by long-term climate trends, researchers studied the fluctuating heights of three glaciers: the La Perouse Glacier in North America, the Viedma Glacier in South America and the Skamri Glacier located in Central Asia.

Their analysis revealed that between 2019 and 2023, the Viedma Glacier (Argentina) and the La Perouse Glacier (Alaska) experienced consistent thinning, but the Skamri Glacier (Pakistan) had been stable enough to experience a small net gain of ice, said Rongjun Qin, co-author of the study and an associate professor of civil, environmental and geodetic engineering at The Ohio State University.
Measurements in this study were made using daily high-resolution images gathered by the PlanetScope satellite constellation, which researchers then used to create 3D reconstructions of how glacial ice flows evolved over time. By incorporating local and global climate data into these models to explore seasonal variations of glacier melt, the team essentially designed a way to monitor the behavior of glaciers across diverse regions.
“This is something that we’ve been thinking about for a long time, because existing glacier studies have such sparse seasonal observations since it’s difficult to get data out of remote areas,” said Qin, who is also a core faculty member of Ohio State’s Translational Data Analytics Institute. “What we wanted to do is to use medium-to-high resolution data to broaden those capabilities and improve the accuracy of the 3D models generated from that data.”
The study was recently published in the journal GIScience & Remote Sensing.
According to the study, while many modern 2D tracking techniques can provide valuable insights into glacier flow, previous studies tend to capture only short-term snapshots or else offer observations without in-depth motion analysis or high-resolution 3D data. This team’s work may help scientists keep better track of seasonal climate issues like glacier melt and expand long-term observations of these masses, and their 3D model method also reveals new data about how quickly the glaciers react to changes in the weather.
The Viedma and Skamri Glaciers, for example, exhibit a 45-day lag time in response to changes in local climate conditions like rain or snow. The La Perouse Glacier, however, was shown to react to changes almost immediately, meaning that its flow can very quickly become faster or slower based on how much precipitation it has accumulated.
In another finding, researchers concluded that behavior differences in all three are driven by distinct environmental and climatic conditions, but suggest that both local and global factors, rather than any single one, are responsible for patterns in glacier motion dynamics worldwide.
Such observations are vital to deepening our global understanding of glacier science, and with further improvements, this study’s algorithm could also be a useful tool for future disaster prediction and management, said Qin. Already, scientists have used similar systems to warn communities of natural disasters that would have led to tragedy.
In all, researchers hope that supporting modeling works like this one will inspire more scientists to utilize satellite data to investigate other types of important environmental research questions.
“Hopefully we can build on all sorts of applications that people are interested in with this,” said Qin.
Shengxi Gui of Ohio State was a co-author. This work’s data was provided by PlanetScope.
Journal Reference:
Gui, S. & Qin, R., ‘Using PlanetScope-derived time-series elevation models and orthophotos to track glacier 3D dynamics in mid-latitude mountain regions’, GIScience & Remote Sensing 62, 1, (2025). DOI: 10.1080/15481603.2025.2507470
Article Source:
Press Release/Material by Tatyana Woodall | Ohio State University (OSU)
Featured image credit: Gerd Altmann | Pixabay