Explore the latest insights from top science journals in the Muser Press daily roundup (July 10, 2025), featuring impactful research on climate change challenges.
In brief:
EU agricultural policy could have major co-benefits for climate and biodiversity
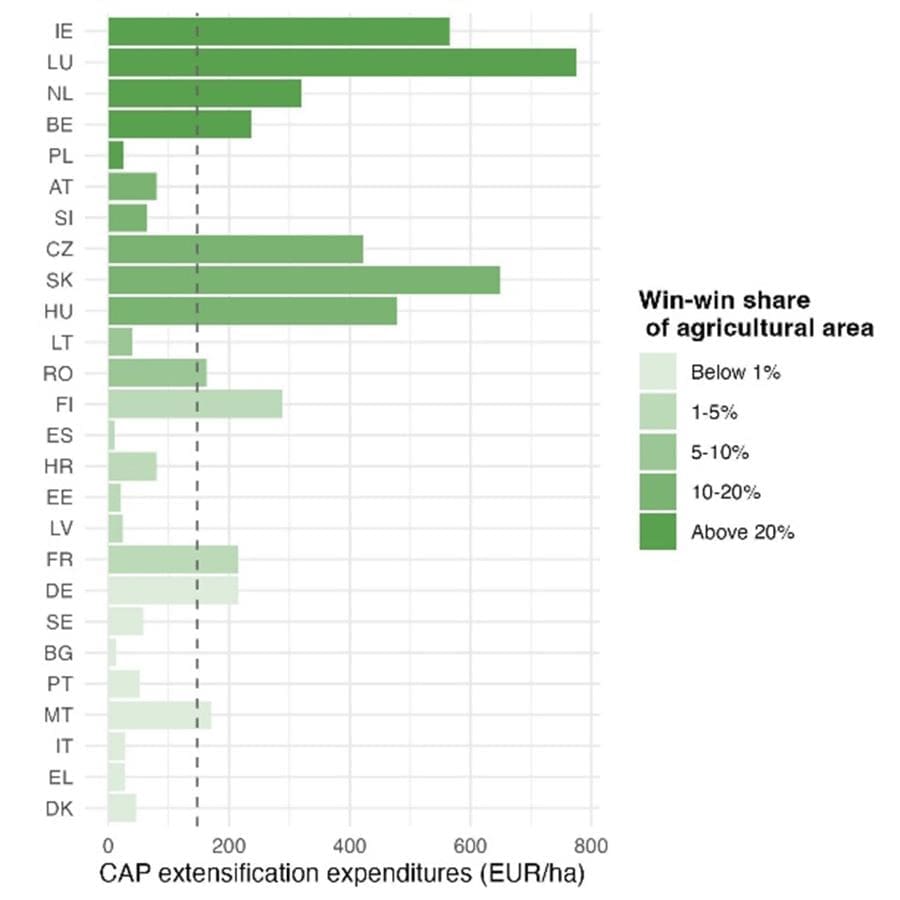
The Common Agricultural Policy (CAP) is the European Union’s agricultural policy framework, focused on tackling climate change, protecting natural resources, and enhancing biodiversity. Recent research, conducted by the LAMASUS consortium, shows that strategic de-intensification of agriculture could produce major co-benefits for climate, biodiversity, and farm profitability.
“While the environmental benefits of reducing intensive farming practices – such as using less fertilizer and pesticides, keeping fewer animals per hectare, and growing crops less frequently – are well recognized within the research community, our study goes further by identifying specific win-win areas where co-benefits for both climate and biodiversity can be achieved at minimal economic cost,” says Leopold Ringwald, coauthor of the study and researcher at the IIASA Integrated Biosphere Futures Research Group.

The study reveals several important insights with strategic implications for EU agricultural policy:
- Strategic de-intensification on 7.0% of EU agricultural land – in win-win areas – could reduce agricultural emissions by 4.9%, equivalent to a total reduction of an estimated 12 million tons of CO2-equivalent per year. This would represent around 3.9% of the EU’s 2030 total mitigation target for agriculture, forestry and other land use, while entailing a 2.0% annual reduction in total agricultural production value.
- In win-win areas, investing at least €350 per hectare is estimated to increase the variety and abundance of native species by 1%. This is a significant figure. For comparison, European biodiversity intactness improved by just 1.1% between 2000 and 2018.
- Scientists identified three countries with above-average shares of win-win areas but below-average planned support per hectare for de-intensification – Poland, Austria, and Slovenia. In particular, Poland and Austria have over 50% of their agricultural land classified as intensively used. Redirecting funds toward these areas could improve biodiversity and climate outcomes per euro spent.
- Result-based payments could offer a promising way forward enabling flexible, outcome-oriented support while encouraging uptake where environmental returns are highest. Restructuring the de-intensification-focused direct payments and eco-schemes might enable further environmentally friendly outcomes at potentially low production value losses.
The researchers further highlight the fact that foreseen CAP funding does not always align with regions where de-intensification would be most effective, emphasizing the need to ensure that policy efforts are focused where they deliver the greatest impact and achieve climate and biodiversity goals without compromising food security.
The study identifies five key CAP policy areas that could help foster agricultural de-intensification. Those include: fertilisation policies promoting the use of organic fertilizers instead of synthetic ones; grassland and grazing policies focused on improving biodiversity and soil health; landscape conservation measures; plant protection policies promoting biological pest control instead of insecticide; low-input farming systems and self-sustaining agriculture.
Publication:
Krisztin, T., Ringwald, L., Balkovic, J., Cornford, R., Freund, C., Havlík, P., Lauerwald, R., O’Connor, L., Renhart, A., Tan, E., Visconti, P. (2025) ‘Maximizing CAP impact: Advancing Climate, Biodiversity, and Farm Profitability Through Strategic Action’
Article Source:
Press Release/Material by International Institute for Applied Systems Analysis (IIASA)
Climate change lowers precipitation, leads to ‘inevitable drought’ in Southwest
A new Cornell University study, published in Nature Geoscience, shows that climate change and aerosols have led to lower precipitation in the Southwest and made drought inevitable. The research is the first to isolate the variables of human-caused climate change and air pollution to show how they directly affect the region’s precipitation; the study predicts that drought conditions will likely continue as the planet warms.
“What we find is that precipitation is more directly influenced by climate change than we previously thought, and precipitation is pretty sensitive to these external influences that are caused by humans,” said Flavio Lehner, senior author and assistant professor of earth and atmospheric sciences.
A trend towards lower precipitation in the Southwest started around 1980, with the onset largely attributed to La Niña-like conditions, a climate phenomenon that results in cooler surface temperatures in the tropical Pacific Ocean. The new research shows that even if El Niño-like conditions had prevailed instead, the Southwest would not have experienced a corresponding increase in precipitation.

“In our models, if we see a warming trend in the tropical Pacific, we would expect more precipitation in the Southwestern United States, but that’s not the case here,” said first-author and doctoral student Yan-Ning Kuo. “On top of the El Niño and La Niña sea surface temperature trends, there’s a uniform warming trend because of historical climate change, as well as emissions from anthropogenic aerosols, that both create a certain circulation pattern over the North Pacific. Those two factors prevent the precipitation for the Southwestern U.S. from increasing, even under El Niño-like trends.”
Lehner said the results point to a bigger shift in the connection between the weather in the tropical Pacific and in the U.S., due to climate change and aerosols.
“What we call a teleconnection from that region to the Southwestern U.S. is changing systematically,” he said, “and these external influences really modulate that relationship, so it doesn’t behave exactly how we expect it to behave.”
There is some good news. Researchers expect that the concentration of aerosols – which includes the emissions from vehicles and industry – will drop as China and other countries in East Asia implement policies to improve air quality. But Lehner said warming temperatures may offset those improvements.
“Most experts expect the world as a whole to reduce air pollution, and globally, it’s already going down quite quickly. That’s good news on the precipitation side,” Lehner said. “At the same time, the warming is going to continue as far as we can tell, and that will gradually outweigh those benefits, as a warmer atmosphere tends to be thirstier, gradually drying out the Southwest.”
***
The study was supported by NOAA, the U.S. Department of Energy, the National Science Foundation and the Australian Research Council Centre of Excellence for Climate Extremes.
For additional information, read this Cornell Chronicle story.
Journal Reference:
Kuo, YN., Lehner, F., Simpson, I.R. et al., ‘Recent southwestern US drought exacerbated by anthropogenic aerosols and tropical ocean warming’, Nature Geoscience (2025). DOI: 10.1038/s41561-025-01728-x
Article Source:
Press Release/Material by Kaitlyn Serrao | Cornell University
Prolonged humid-heat seasons in eastern China threaten public health, especially for the elderly and children
When scorching temperatures meet high humidity, the air can feel suffocating, much like being trapped in a sauna. “It’s no longer just hot – it’s dangerous,” says Prof. Miaoni Gao, a climate scientist from Nanjing University of Information Science and Technology, China.
Unlike dry heat, humid conditions limit the body’s ability to cool itself through sweating, increasing the risk of heat-related illnesses. In recent years, these compound heat–humidity extremes – also known as humid-heat waves – have become more frequent and intense across eastern China. Vulnerable groups such as the elderly and children are particularly affected, as their bodies are less capable of adapting to extreme conditions.

As global warming accelerates, humid-heat stress is emerging as a major yet under-recognized public health challenge in densely populated regions.
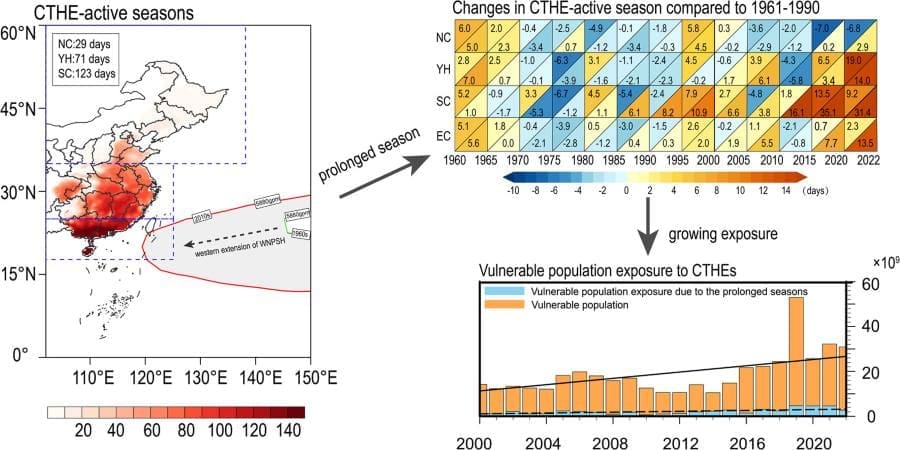
In a new study published in Atmospheric and Oceanic Science Letters, Prof. Miaoni Gao‘s team reports that compound heat–humidity extremes in eastern China are now lasting longer than ever before, significantly increasing health risks, particularly for the elderly and young children. Based on climate records dating back to 1961, the researchers found that the active season for compound heat–humidity extremes has expanded, especially in the Yangtze–Huaihe region and South China. Over the past decade, the season in South China alone has lengthened by about one month.
What’s driving this trend? “It’s the western expansion of the Western North Pacific Subtropical High,” explains Prof. Gao. This climatic shift intensifies solar radiation and drives persistent warm air and moisture into eastern China, amplifying and prolonging the active season of compound heat–humidity extremes.
But heatwaves aren’t just weather events – they’re also public health emergencies. In 2023 alone, over 37,000 heat-related deaths were recorded nationwide. The study found that physiologically vulnerable groups – primarily the elderly and young children – now make up 39% of the total population exposed to compound heat–humidity extremes. Notably, one-third of the increase in exposure can be attributed to the lengthening of the heatwave season. In South China, this proportion soars to 56%.
As China’s population continues to age, with over 200 million people now aged 65 or older, the convergence of demographic vulnerability and extended heatwave seasons could lead to a major public health crisis.
The researchers call for urgent action: “We can no longer rely on fixed-schedule summer warnings,” says co-author Ms. Xinyue Sun. “We need dynamic early warning systems that reflect the changing timing of heatwave seasons, along with targeted health interventions to protect the most vulnerable populations.”
Journal Reference:
Miaoni Gao, Xinyue Sun, Buda Su, Lu Tang, Xingyu Cheng, Tong Jiang, ‘Prolonged seasons of compound heat–humidity extremes amplify vulnerable population exposure in eastern China’, Atmospheric and Oceanic Science Letters 100663 (2025). DOI: 10.1016/j.aosl.2025.100663
Article Source:
Press Release/Material by Institute of Atmospheric Physics, Chinese Academy of Sciences (IAP | CAS)
What environmental factors determine fish life history strategies in a river?
How do fish respond to changing hydrological and climatic conditions? This question lies at the core of ecological research. Previous studies have shown that life history traits in fish represent adaptive evolutionary responses shaped by long-term natural selection, and the life history theory offers a theoretical framework for understanding how environmental changes influence the composition and distribution of fish communities.

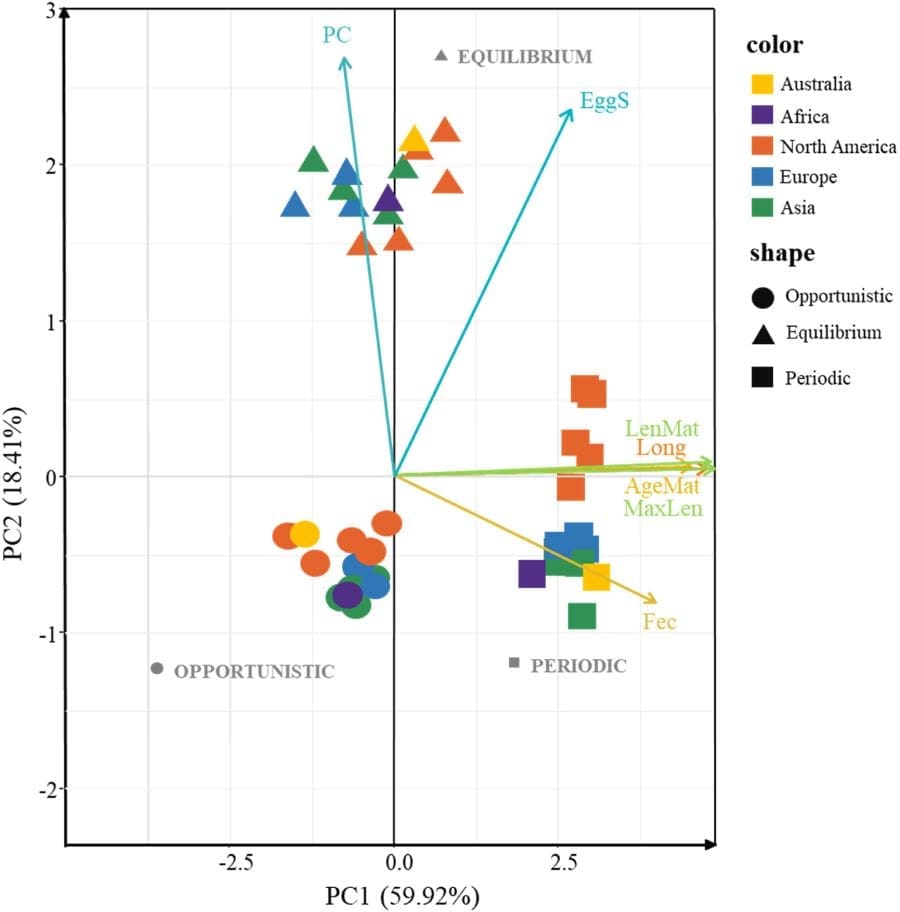
Recently, a multinational research team compiled life history trait data for 1,613 fish species across 14 major rivers worldwide. Their analysis revealed significant variation in the proportion of opportunistic, periodic, and equilibrium strategies among river systems. These differences were strongly associated with key environmental variables, including mean annual temperature, annual precipitation, annual variation in river discharge, and latitude.
“We found that opportunistic strategists are better adapted to warm, precipitation-rich rivers with high hydrological variability, whereas periodic strategists tend to thrive in systems with more predictable flow regimes,” explained Lan Zhu, lead author of the study published in Water Biology and Security.
In addition, the researchers conducted a molecular phylogenetic analysis of 230 fish species from the Yangtze River to reconstruct the evolutionary history of their life history strategies.
“The results showed that before the Paleocene, it was dominated by periodic strategists,” shares Zhu. “However, since the prevalence of a monsoon climate and the overall alteration of precipitation patterns in the Miocene, the proportion of opportunistic strategists increased, suggesting a life history shift driven by climate-induced environmental instability.”
The team’s not only reveals the evolutionary pattern of life history strategies of Yangtze fishes, but also provides a theoretical foundation for ecological monitoring and management of riverine ecosystems in the future.
Journal Reference:
Lan Zhu, Dan Yu, Martin Reichard, Mingzheng Li, Jiaxin Gao, Huanzhang Liu, ‘Key environmental factors determining life history strategies of river fishes and their historical changes in the Yangtze River’, Water Biology and Security 4 (3) 100376 (2025). DOI: 10.1016/j.watbs.2025.100376
Article Source:
Press Release/Material by KeAi Publishing
Banking on AI while committed to net zero is ‘magical thinking’, claims report on energy costs of big tech
By 2040, the energy demands of the tech industry could be up to 25 times higher than today, with unchecked growth of data centres driven by AI expected to create surges in electricity consumption that will strain power grids and accelerate carbon emissions.
This is according to a new report from the University of Cambridge’s Minderoo Centre for Technology and Democracy, which suggests that even the most conservative estimate for big tech’s energy needs will see a five-fold increase over the next 15 years.
The idea that governments such as the UK can become leaders in AI while simultaneously meeting their net zero targets1 amounts to “magical thinking at the highest levels,” according to the report’s foreword.
The report authors call for global standards in reporting AI’s environmental cost through forums such as COP, the UN climate summit, and argue that the UK should advocate for this on the international stage while ensuring democratic oversight at home.
The report synthesises projections from leading consultancies to forecast the energy demands of the global tech industry. The researchers note that these projections are based on claims by tech firms themselves.

At the moment, data centres – the facilities that house servers for processing and storing data, along with cooling systems preventing this hardware from overheating – account for nearly 1.5% of global emissions.
This figure is expected to grow by 15-30% each year to reach 8% of total global greenhouse gas emissions by 2040, write the report’s authors. They point out that this would far exceed current emissions from air travel.
The report highlights that in the US, China, and Europe, data centres already consume around 2-4% of national electricity, with regional concentrations becoming extreme. For example, up to 20% of all power in Ireland now goes to data centres in Dublin’s cluster.
“We know the environmental impact of AI will be formidable, but tech giants are deliberately vague about the energy requirements implicit in their aims,” said Bhargav Srinivasa Desikan, the report’s lead author from Cambridge’s Minderoo Centre.
“The lack of hard data on electricity and water consumption as well as associated carbon emissions of digital technology leaves policymakers and researchers in the dark about the climate harms AI might cause.”
“We need to see urgent action from governments to prevent AI from derailing climate goals, not just deferring to tech companies on the promise of economic growth,” said Desikan.
The researchers also use data from corporate press releases and ESG reports of some of the world’s tech giants to show the alarming trajectory of energy use before the AI race had fully kicked into gear.
Google’s reported greenhouse gas emissions rose by 48% between 2019 and 2023, while Microsoft’s reported emissions increased by nearly 30% from 2020 to 2023. Amazon’s carbon footprint grew around 40% between 2019 and 2021, and – while it has begun to fall – remains well above 2019 levels.
This self-reported data is contested, note the researchers, and some independent reporting suggests that actual emissions from tech companies are much higher.
Several tech giants are looking to nuclear power to defuse the energy timebomb at the heart of their ambitions. Sam Altman, CEO of OpenAI, has argued that fusion is needed to meet AI’s potential, while Meta have said that nuclear energy can “provide firm, baseload power” to supply their data centres.
Microsoft have even signed a 20-year agreement to reactivate the Three Mile Island plant – site of the worst nuclear accident in US history.
Some tech leaders, such as former Google CEO Eric Schmidt, argue that environmental costs of AI will be offset by its benefits for the climate crisis – from contributing to scientific breakthroughs in green energy to enhanced climate change modelling.
“Despite the rapacious energy demands of AI, tech companies encourage governments to see these technologies as accelerators for the green transition,” said Prof Gina Neff, Executive Director of the Minderoo Centre for Technology and Democracy.
“These claims appeal to governments banking on AI to grow the economy, but they may compromise society’s climate commitments.”
“Big Tech is blowing past their own climate goals, while they rely heavily on renewable energy certificates and carbon offsets rather than reducing their emissions,” said Prof Neff.
“Generative AI may be helpful for designing climate solutions, but there is a real risk that emissions from the AI build-out will outstrip any climate gains as tech companies abandon net zero goals and pursue huge AI-driven profits.”
The report calls for the UK’s environmental policies to be updated for the “AI era”. Recommendations include adding AI’s energy footprint into national decarbonisation plans, with specific carbon reduction targets for data centres and AI services, and requirements for detailed reporting of energy and water consumption.
Ofgem should set strict energy efficiency targets for data centres, write the report’s authors, while government departments such as DESNZ and DSIT2 should tie AI research funding and data centre operations to clean power adoption.
The report’s authors note that that UK’s new AI Energy Council currently consists entirely of energy bodies and tech companies – with no representation for communities, climate groups or civil society.
“Energy grids are already stretched,” said Prof John Naughton, Chair of the Advisory Board at the Minderoo Centre for Technology and Democracy.
“Every megawatt allocated to AI data centres will be a megawatt unavailable for housing or manufacturing. Governments need to be straight with the public about the inevitable energy trade-offs that will come with doubling down on AI as an engine of economic growth.”
***
Notes:
(1) The UK is committed to net zero greenhouse gas emissions by 2050.
(2) DESNZ: the UK’s Department for Energy Security and Net Zero. DSIT: the UK’s Department for Science, Innovation and Technology.
Reference:
Srinivasa Desikan, B., & Neff, G., ‘Evidence Review: Big Tech’s Climate Performance and Policy Implications for the UK’, Minderoo Centre for Technology and Democracy (2025). DOI: 10.17863/CAM.119617
Article Source:
Press Release/Material by University of Cambridge
Featured image credit: Gerd Altmann | Pixabay


