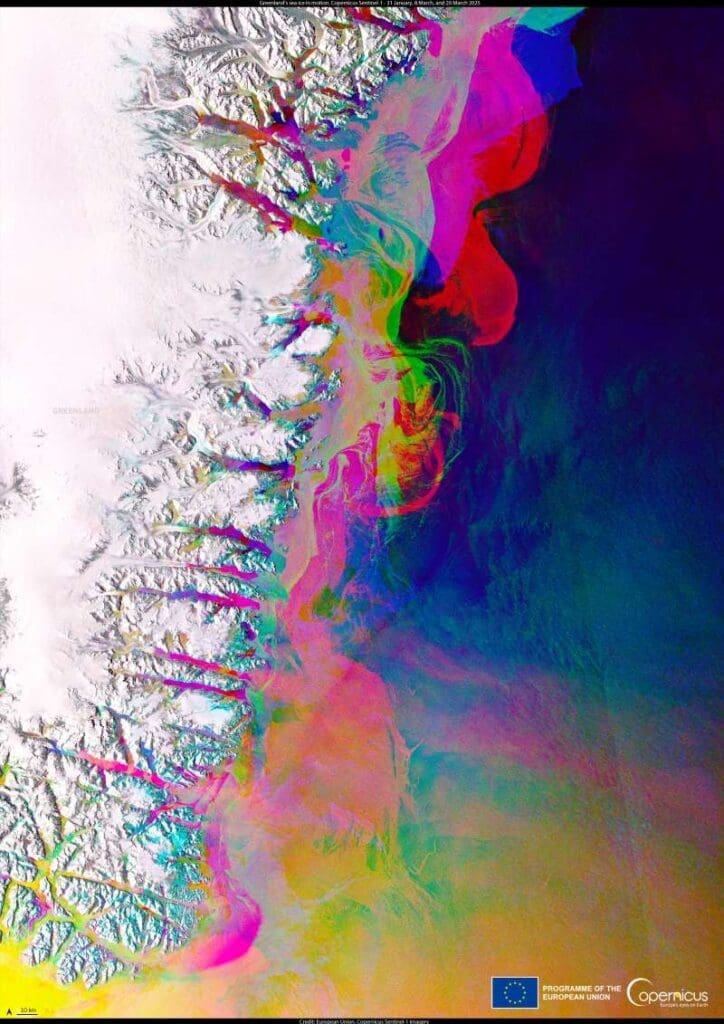
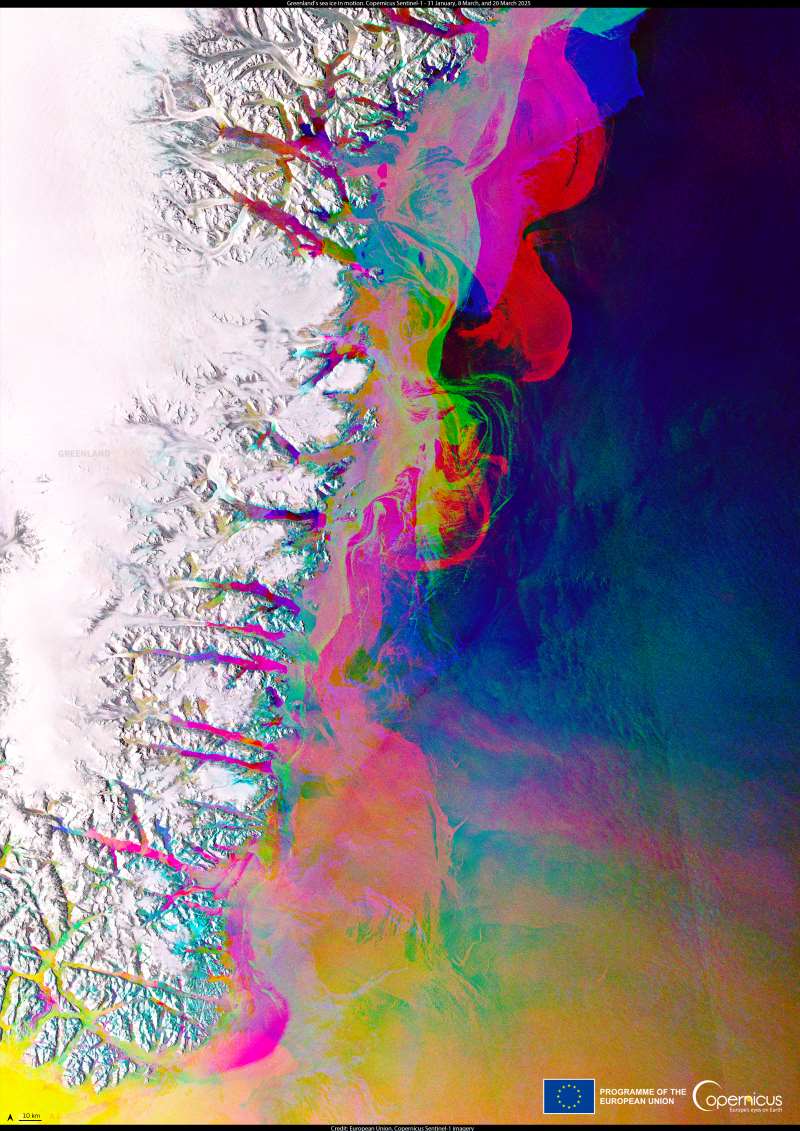
The changing coastline of south-eastern Greenland is shown in this composite created from three radar observations by the Copernicus Sentinel-1 mission, collected on 31 January, 8 March, and 20 March 2025.
The image overlays the three acquisitions to produce multicoloured interference patterns, each hue marking a shift in the position of glaciers or sea ice. Rainbow-like bands trace where the ice front has advanced or retreated between the satellite passes, making visible the constant motion of Greenland’s frozen edge.
This stretch of coast is marked by deep fjords carved into the mountains, where some of Greenland’s largest outlet glaciers meet the sea. Glaciers such as Helheim, Kangerdlugssuaq, and Sermilik drain vast areas of the ice sheet, flowing rapidly toward the ocean and releasing enormous volumes of ice. The interference patterns in the image reveal how quickly these ice streams can change, advancing during colder spells or breaking apart in dramatic calving events.

Radar is essential for documenting these dynamics. Unlike optical instruments, radar can see through clouds and capture data in darkness, ensuring uninterrupted monitoring throughout the Arctic winter. With Sentinel-1, researchers can track the speed of glacier flow, map sea ice drift, and study how icebergs are discharged into the North Atlantic.
Greenland’s ice sheet contains enough frozen water to raise global sea levels by about seven metres if fully melted. Although complete loss is not expected, the region is currently the single largest contributor to sea level rise. Detailed satellite records are critical to measuring this contribution and improving predictions of future change.
The Sentinel-1 data provide a continuous record of these processes, giving scientists the ability to observe not only dramatic calving events but also the slower, steady loss of ice that reshapes Greenland’s coastline year after year.
Featured image credit:: European Union, Copernicus Sentinel-1 imagery


