Explore the latest insights from top science journals in the Muser Press daily roundup (September 3, 2025), featuring impactful research on climate change challenges.
In brief:
Climate change is making rollercoaster harvests the new normal
From corn chips to tofu, climate change is messing with the menu.
A new global study led by the University of British Columbia shows that hotter and drier conditions are making food production more volatile, with crop yields swinging more sharply from year to year. For some, it may mean pricier burgers; for others, it can bring financial strain and hunger.
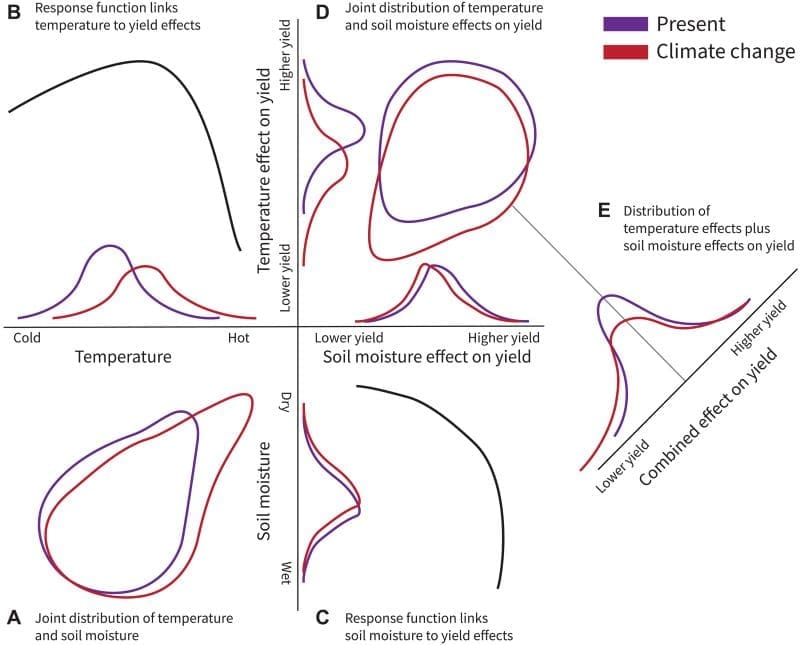
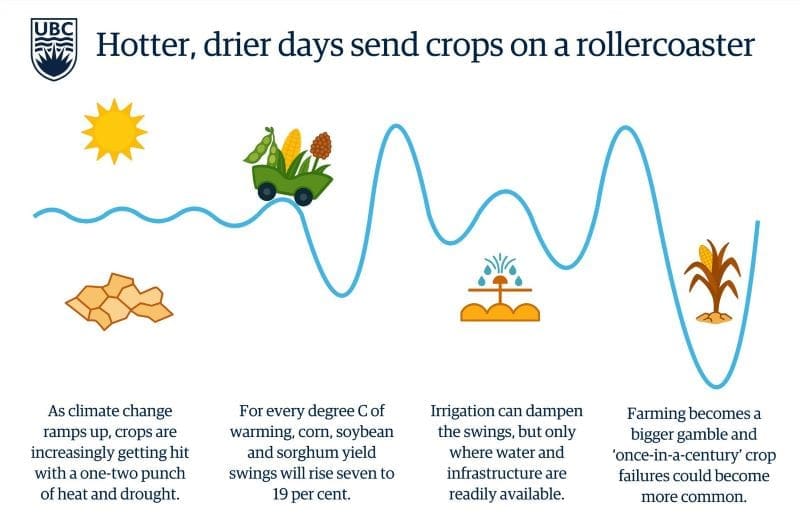
Published in Science Advances, the study is the first to show at a global scale how climate change is affecting yield swings of three of the world’s most important food crops: corn, soybean and sorghum. For every degree of warming, year-to-year variability in yields rises by seven per cent for corn, 19 per cent for soybeans and 10 per cent for sorghum.

While previous research has focused on climate-driven declines in average yields, this study highlights a compounding danger: instability.
For many farmers, those swings aren’t abstract. They’re the difference between getting by and going under.
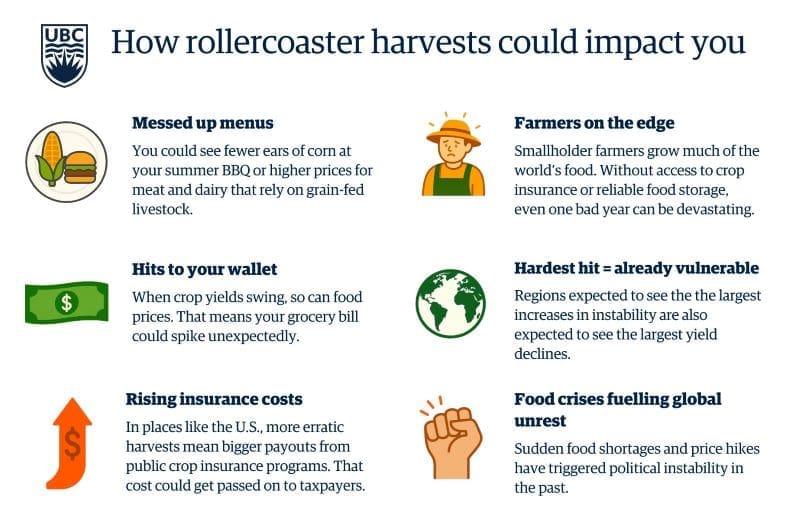
“Farmers and the societies they feed don’t live off of averages – they generally live off of what they harvest each year,” said Dr. Jonathan Proctor, an assistant professor at UBC’s faculty of land and food systems and the study’s lead author. “A big shock in one bad year can mean real hardship, especially in places without sufficient access to crop insurance or food storage.”
Boom, bust, repeat
While average yields may not plummet overnight, as year-to-year swings grow, so does the chance of “once-in-a-century” crop failures, or very poor harvests.
At just two degrees of warming above the present climate, crop disasters could become more frequent. Soybean crop failures that once struck once every 100 years would happen every 25 years. Corn failures would go from once a century to every 49 years, and sorghum failures to every 54 years.
If emissions continue to grow , soybean failures could hit as often as every eight years by 2100.
Some of the regions most at risk are also the least equipped to cope, including parts of Sub-Saharan Africa, Central America and South Asia, where many farms rely heavily on rainfall and have limited financial safety nets.
The consequences won’t be limited to lower-income regions. In 2012, for example, a drought and heatwave in the U.S. Midwest caused corn and soybean yields to drop by a fifth, costing the U.S. billions and sparking concern in markets around the world. Within months, global food prices jumped nearly 10 per cent.

Double trouble
To understand how these overlapping stresses affect crops at a global scale, the researchers combined global harvest records with high-resolution measures of temperature and soil moisture from stations, satellites and climate models.
“A key driver of these wild swings? A double whammy of heat and dryness, increasingly arriving together,” said Dr. Proctor.
Hot weather dries out the soil. Dry soil, in turn, makes heatwaves worse by allowing temperatures to rise more quickly. And climate change intensifies these processes.
“If you’re hydrated and go for a run your body will sweat to cool down, but if you’re dehydrated you can get heatstroke,” said Dr. Proctor. “The same processes make dry farms hotter than wet ones.”
Even brief spells can slash yields in these conditions – disrupting pollination, shortening growing seasons and stressing plants beyond recovery.
For soybeans and sorghum in particular, the growing overlap between heat and moisture explains a large portion of the increase in volatility.

Irrigation can help – if water is available
Irrigation can effectively reduce yield instability, the study shows, where irrigation water is available. Many of the most at-risk regions, however, already face water shortages or lack irrigation infrastructure.
To build resilience, the authors call for urgent investment in heat- and drought-resistant crop varieties, improved weather forecasting, better soil management and stronger safety nets, including crop insurance. But the most reliable solution is to cut emissions driving global warming.
“Not everyone grows food, but everyone needs to eat,” said Dr. Proctor. “When harvests become more unstable, everyone will feel it.”
Journal Reference:
Jonathan Proctor, Lucas Vargas Zeppetello, Duo Chan, and Peter Huybers, ‘Climate change increases the interannual variance of summer crop yields globally through changes in temperature and water supply’, Science Advances 11, 36: eady3575 (2025). DOI: 10.1126/sciadv.ady3575
Article Source:
Press Release/Material by Sachi Wickramasinghe | University of British Columbia (UBC)
Decades of data show African weather disturbances intensify during La Niña
A study led by scientists at the University of Miami Rosenstiel School of Marine, Atmospheric, and Earth Science and the National Center for Atmospheric Research (NCAR) reveals how a major global climate pattern influences the African weather systems that help seed Atlantic hurricanes.
The findings, published in the Journal of Climate, could lead to better seasonal forecasts of rainfall, drought, and tropical cyclone activity across the Atlantic basin.

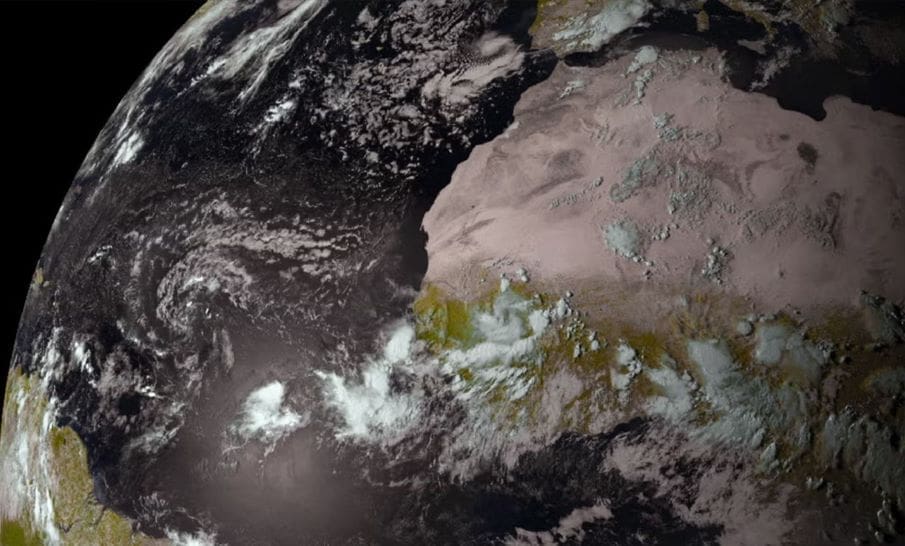
African easterly waves (AEWs) – atmospheric disturbances that travel across the African continent – play a crucial role in both West African rainfall and the development of most Atlantic hurricanes. The new study shows that the El Niño–Southern Oscillation (ENSO) strongly shapes how these waves behave.
“We found that during La Niña years, AEWs are stronger, moister, and have more thunderstorm activity compared to El Niño years,” said Quinton Lawton, a doctoral alumnus of the Rosenstiel School and now a scientist at NCAR. “These seasonal changes could impact local weather patterns and may be another piece of the puzzle in explaining why Atlantic hurricanes are more active during La Niña.”
The study began as an undergraduate research project by Brooke Weiser, who developed it into her honors thesis under the advisement of Lawton. Weiser, now an analyst at Moody’s Insurance Solutions, collaborated with Lawton and Sharan Majumdar, a professor in the Department of Atmospheric Sciences at the Rosenstiel School. Together, the team analyzed more than four decades of global weather data using an innovative tracking tool called QTrack, developed by Lawton during his doctoral studies at the Rosenstiel School and now widely used by forecasting centers and researchers worldwide.
“Our research presents a detailed climatology of AEWs and their year-to-year variability, allowing us to examine their characteristics and links to climate oscillations with greater precision than before.” Weiser said.
“This work highlights the opportunities our undergraduates have to contribute to high-impact meteorological research,” said Majumdar. “It’s also a great example of graduate-undergraduate mentorship, and collaboration between the Rosenstiel School and NCAR.”
By clarifying how ENSO impacts AEWs, the study paves the way to more accurate seasonal predictions that can benefit communities across Africa, the Caribbean, and the Americas. Better forecasts of rainfall, drought, and hurricane risk can give farmers, emergency managers, and residents more time to prepare.
Journal Reference:
Lawton, Q. A., B. Weiser, and S. J. Majumdar, ‘On the Interannual Variability of African Easterly Waves and Its Relationship with the El Niño – Southern Oscillation’, Journal of Climate (2025). DOI: 10.1175/JCLI-D-25-0113.1
Article Source:
Press Release/Material by Diana Udel | University of Miami | Rosenstiel School of Marine, Atmospheric, and Earth Science
Hurricane Sandy linked to lasting heart disease risk in elderly
The study, published in JAMA Network Open, found that older adults living in flood-hit areas in New Jersey faced a 5% higher risk of heart disease for up to five years after Sandy’s landfall. This is one of the first studies to rigorously quantify long-term cardiovascular risks associated with flooding in older adults. Most studies focus on the immediate consequences of severe weather events.
“Climate-amplified hurricanes and hurricane-related floods are expected to increase into the future,” said Dr. Arnab Ghosh, assistant professor of medicine at Weill Cornell Medicine and an internist at NewYork-Presbyterian/Weill Cornell Medical Center, who led the research. “So, it’s essential to understand the long-term health effects on those most vulnerable.”

Natural controlled experiment
The researchers analyzed Medicare data from over 120,000 people aged 65 and older living in New Jersey, New York City, and Connecticut in the five years after the storm.
They compared ZIP code areas that were flooded during the hurricane to nearby ZIP code areas that weren’t, matching the communities in terms of age, income, race and health status before the storm. Using advanced statistical models, the team tracked heart-related health events like heart attacks, strokes and heart failure in people who did not relocate after the hurricane.
“Capitalizing on such a large, diverse and stable patient population as Medicare recipients, allowed our team to see broader population trends while controlling for many of the threats to validity, whether socio-economic factors or the prevalence of co-morbidities,” said senior author Dr. David Abramson, clinical professor of social and behavioral sciences in the School of Global Public Health at New York University.
The researchers concluded that heart failure rates were higher in flooded areas, especially in New Jersey, and that the risk persisted for four to five years – not just weeks or months – after the storm.

They hypothesize that more people in New Jersey were directly affected by the storm’s physical and emotional stressors. Flooded zip codes in New Jersey had lower median incomes and higher area deprivation index scores, which are indicators of social and economic disadvantage. These factors are linked to worse health outcomes and lower access to care, especially after a disaster. The residents also faced lingering difficult environmental and psychological circumstances and reduced community support.
In a related study published last month in Frontiers in Public Health, Dr. Ghosh and his colleagues found that the rate of death in elderly individuals living in areas flooded after Sandy was 9% higher on average five years later compared to those in less affected neighborhoods. The magnitude of this effect varied by region. While New York City saw an 8% increase in mortality, Connecticut had a 19% increase. However, the rest of coastal New York, including Long Island, and New Jersey seemed to escape this effect.
“The regional differences that we noted may highlight how local environments differ and need further examination,” Dr. Ghosh said. “New York City, for example, is heavily urbanized, while impacted parts of Connecticut and New Jersey are suburban with different infrastructure and more single-family homes.”
Taking a longer-term view
The study suggests that disaster preparedness and recovery frameworks should integrate chronic disease management and long-term health monitoring, not just short-term emergency care. The findings are particularly relevant for climate resilience planning, especially in regions with aging populations and increasing hurricane exposure.
“We are starting to appreciate that disasters are happening more frequently. But our policies and support systems for vulnerable groups after severe weather has struck haven’t been well developed,” Dr. Ghosh said.
Given the regional variation in health outcomes, localized health system preparedness is essential, added the researchers. This includes resource allocation, training and infrastructure to manage chronic disease burdens in the aftermath of disasters.
“With this work, we lay the groundwork to show that hurricanes can have long-term impacts on health,” said Dr. Ghosh. Building on these results, the researchers are now planning to conduct larger-scale analyses on the health consequences of other events such as wildfires and tornadoes. Another aspect they plan to study involves how increased health risks related to weather affect Medicare, Medicaid and the health care system financially.
Journal Reference:
Ghosh AK, Soroka O, Safford M, et al., ‘Hurricane Exposure and Risk of Long-Term Cardiovascular Disease Outcomes’, JAMA Network Open 8 (9): e2530335 (2025). DOI: 10.1001/jamanetworkopen.2025.30335
Article Source:
Press Release/Material by Weill Cornell Medicine
Featured image credit: Gerd Altmann | Pixabay


