Explore the latest insights from top science journals in the Muser Press daily roundup (May 7, 2025), featuring impactful research on climate change challenges.
In brief:
A robust method to determine the beginning of a new climate
Scientists from the University of Groningen and the Royal Netherlands Meteorological Institute (KNMI) have developed a method to predict time of emergence in various Arctic regions, based on warming, wetting, and sea ice melting. The ToE for temperature and sea ice is in the near future, i.e. somewhere before 2050, whereas the amount of rainfall will enter a new climate state at the end of the century.
The results have been published in the journal Scientific Reports.

The scientists have used 14 global climate models and fed them with various greenhouse gas emission scenarios and aerosol amounts to reconstruct the past and predict future Arctic climate changes. The ToE was defined as the time when the values for a climate variable have been higher than 97.5 percent of the historical values for ten consecutive years. The results show that, even though the Arctic is rapidly warming, ToE for temperature and sea ice cover has generally not yet been reached. This is mainly due to the extremely high natural variability in these Arctic variables.
Most sensitive predictor for climate change
There are large regional differences. For example, sea ice thickness has already reached a new climate state in the central Arctic region, as there is a relatively small variability in year-to-year thickness. This makes sea ice the most sensitive predictor for climate change.
“We were excited to see that we were able to estimate ToE in a consistent and robust way,” says Richard Bintanja, University of Groningen Professor of Climate and Environmental Change and corresponding author of the study. The new predictions for ToE will help local Arctic inhabitants to adapt to the new Arctic climate. Bintanja: “The next step is to apply these insights in society, policy, and ecology.”
Journal Reference:
Tsakali, N., Kolbe, M., Bintanja, R. et al., ‘The time of emergence of Arctic warming, wetting and sea ice melting’, Scientific Reports 15, 12626 (2025). DOI: 10.1038/s41598-025-96607-1
Article Source:
Press Release/Material by University of Groningen
New study tracks air pollution and CO2 emissions across thousands of cities worldwide
The research led by George Washington University, in collaboration with scientists from Washington University in St. Louis and the University of North Carolina at Chapel Hill, used data from satellite observations, ground-based measurements and computer models to measure city-level air pollution and the average amount of carbon dioxide released into the atmosphere in 13,189 urban areas globally. The study, which highlights regional disparities, focused on the years spanning from 2005-2019.
The study was published in Communications Earth & Environment.
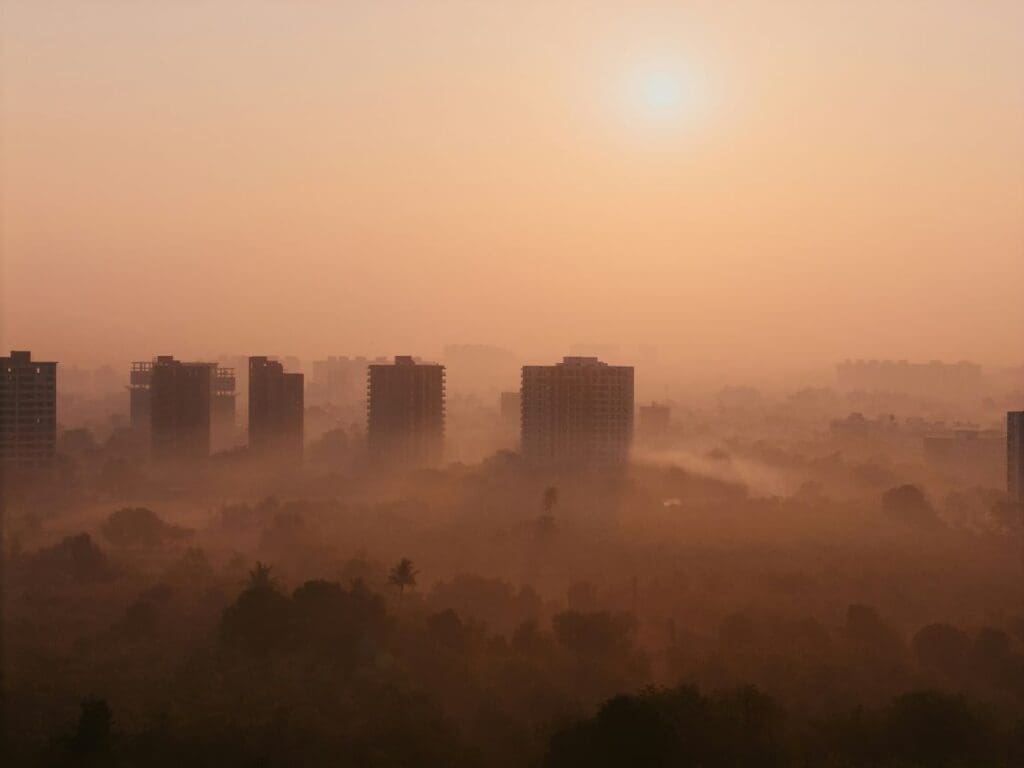
“This study provides a powerful snapshot of how urban environments are evolving across the globe,” said Susan Anenberg, professor of environmental and occupational health at the GW Milken Institute School of Public Health and director of the GW Climate and Health Institute. “It also shows that progress is possible but uneven, with some cities seeing worsening pollution while others are experiencing cleaner air over time.”
Key Findings:
- More than 50% of cities showed links between all pollutants, suggesting they likely come from the same sources and could be reduced together.
- Urban areas in high-income regions with aggressive environmental policies saw simultaneous declines in all pollutants.
- Cities in regions undergoing rapid population and economic growth, including South Asia and parts of Africa, experienced rising pollution and emissions levels.
- Satellite remote sensing provides an unprecedented opportunity to track pollution levels in all cities worldwide.
The study’s integrated approach offers policymakers, researchers and climate advocates a valuable new tool for assessing the effectiveness of strategies to reduce pollution. By tracking historical pollutant trends and analyzing correlations across air pollution, nitrogen dioxide and carbon dioxide emissions, the study offers insights into how urban areas can make progress on both climate and public health goals.
Researchers also created an interactive map and dashboard to track air pollution in cities worldwide.
Journal Reference:
Kim, SY., Kerr, G.H., van Donkelaar, A. et al., ‘Tracking air pollution and CO2 emissions in 13,189 urban areas worldwide using large geospatial datasets’, Communications Earth & Environment 6, 311 (2025). DOI: 10.1038/s43247-025-02270-9
Article Source:
Press Release/Material by George Washington University
Could conserving tigers in forests be an integral part of climate change solutions?
Forests without top predators (such as tigers) risk being overgrazed by large herbivore prey, depleting vegetation carbon stocks and their capacity to remove carbon dioxide from the atmosphere, an essential ecosystem function for mitigating climate change. Therefore, just as forest protection and restoration can support top predator recovery “bottom-up,” large carnivore conservation likely promotes vegetation recovery “top-down” and represents an understudied component in nature-based solutions to climate change.
Research published in Global Change Biology provides new insights into these relationships.

Investigators found that tiger presence is associated with higher forest vegetation carbon stocks per unit area, as well as overall lower carbon dioxide emissions and higher carbon dioxide removal than tiger-absent forests. Also, forest vegetation or soil carbon stocks increased with tiger density in four forest habitat types studied.
The findings reveal that tigers are both an indicator and a driver of forest ecosystem carbon stocks, depending on underlying ecological conditions, and could help safeguard against carbon emissions.
“Our analysis indicates that tiger density can influence forest vegetation carbon stocks by controlling large herbivore prey, but there is important context-dependency and variable outcomes to consider,” said corresponding author Guangshun Jiang, PhD, of Northeast Forestry University, in China. “Rebuilding forest carbon stocks can support tiger population growth, while tiger presence also seems to have a guardian effect to protect forests from deforestation and associated carbon emissions.”
Journal Reference:
Roberts, N.J., Harihar, A., Zhou, X., She, W. and Jiang, G., ‘Global Tiger Density Linked With Forest Carbon Stock, Top-Down and Bottom-Up’, Global Change Biology 31, 5: e70191 (2025). DOI: 10.1111/gcb.70191
Article Source:
Press Release/Material by Wiley
Heat and drought are quietly hurting crop yields
More frequent hot weather and droughts have dealt a significant blow to crop yields, especially for key grains like wheat, barley, and maize, according to a Stanford study published in Proceedings of the National Academy of Sciences. The analysis finds that warming and air dryness – a key factor in crop stress – have surged in nearly every major agricultural region, with some areas experiencing growing seasons hotter than nearly any season 50 years ago. The study also pointed to two important ways that models have missed the mark in predicting impacts so far.
“There have been a lot of news stories about crop failures around the world, and often I get asked whether the impacts are happening faster than we expected,” said study lead author David Lobell, the Gloria and Richard Kushel Director of Stanford’s Center on Food Security and the Environment (FSE). “That motivated a closer look at what’s been happening in farms around the world.”
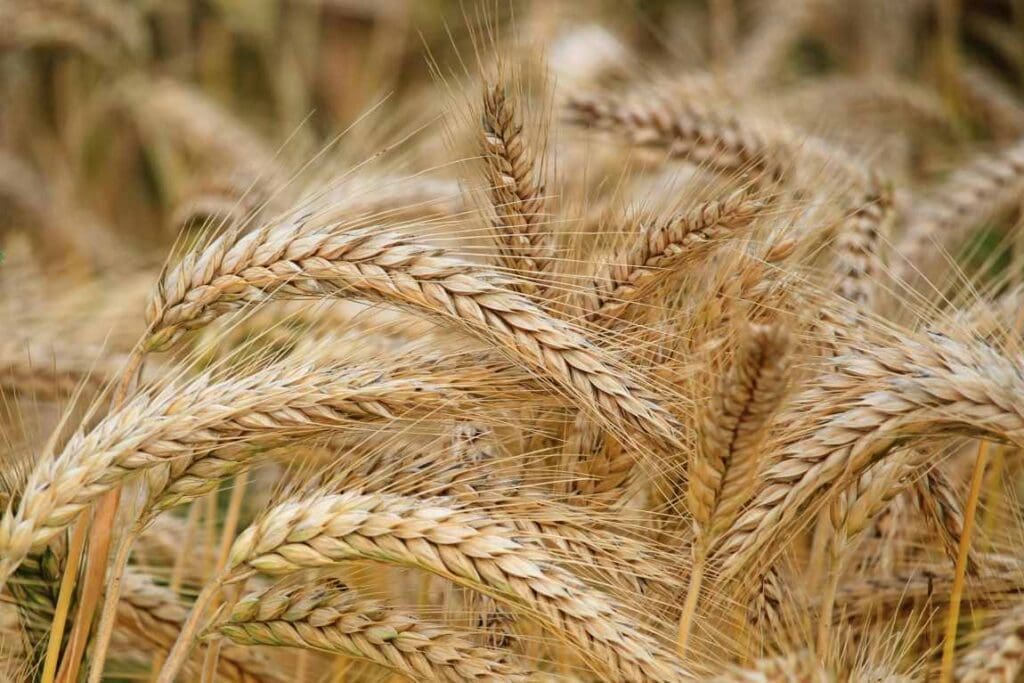
The study estimates that global yields of barley, maize, and wheat are 4 to 13 percent lower than they would have been without climate trends. In most cases, the losses have outweighed the benefits of increased carbon dioxide, which can improve plant growth and yield by boosting photosynthesis, among other mechanisms.
“In many ways, the changes farmers are experiencing are completely in line with what climate models predicted, so the overall impact should not be a surprise,” said study coauthor Stefania Di Tommaso, a research data analyst at FSE.
An unexpected twist: climate models largely failed to predict the scale of drying in temperate zones like Europe and China. Observed increases in air dryness were far greater than projections had indicated for these regions. By contrast, U.S. farms, especially in the Midwest, experienced far less warming and drying than expected.
“These two big surprises are important to resolve” said Di Tommaso “Of all the uncertainties in climate models, these are the two big ones that matter for global food production.”
The authors note that model errors do not only matter for predicting impacts but also for designing adaptations. Past efforts to extend growing seasons with longer-maturing crop varieties, for example, may have missed the mark because models didn’t fully capture the drying trends that now threaten those very strategies.
The findings echo concerns raised in a study published in March that found U.S. agricultural productivity could slow dramatically in coming decades without major investment in climate adaptation. Taken together, the studies highlight a growing need for more accurate modeling and smarter adaptation strategies.
”Overall, I think climate science has done a remarkable job of anticipating global impacts on the main grains, and we should continue to rely on this science to guide policy decisions,” said Lobell. “If anything, I think the blind spots have been on specialized crops where we don’t have as much modeling, but which are very salient to consumers. That includes things like coffee, cocoa, oranges, and olives. All these have been seeing supply challenges and price increases. These matter less for food security but may be more eye-catching for consumers who might not otherwise care about climate change.”
Lobell adds that the surprise many people express may simply be because they had been hoping the climate science was wrong, or because they underestimated the impact a 5% or 10% yield loss would have. “I think when people hear 5% they tend to think it’s a small number. But then you live through it and see it’s enough to shift markets. We’re talking about enough food for hundreds of millions of people.”
Journal Reference:
D.B. Lobell & S. Di Tommaso, ‘A half-century of climate change in major agricultural regions: Trends, impacts, and surprises’, Proceedings of the National Academy of Sciences 122 (20) e2502789122 (2025). DOI: 10.1073/pnas.2502789122
Article Source:
Press Release/Material by Stanford Woods Institute for the Environment
Halo patterns around coral reefs may signal resilience
In coral reefs throughout the world, visually striking bands of bare sand surrounding reefs are often visible in satellite imagery but their cause remains a mystery.
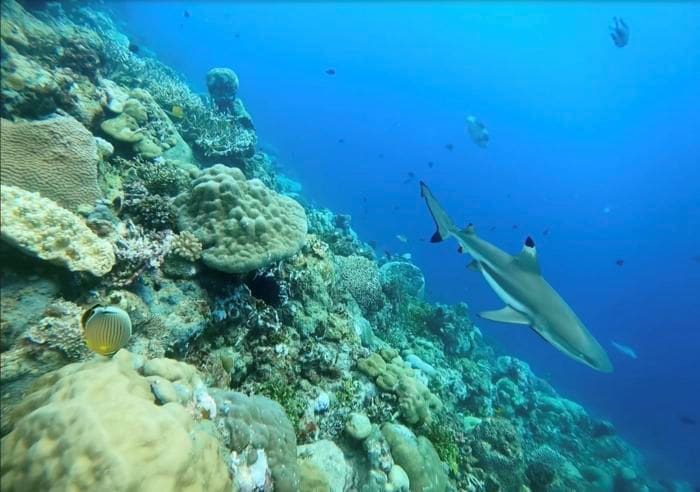
One theory is fear. Parrotfish and other herbivores will leave a reef’s shelter to eat algae or the surrounding seagrass, but their fear of being gobbled up by predators may keep them from roving too far or eating too much, creating, what’s known as “grazing halos” – bands encircling reefs where vegetation once existed.
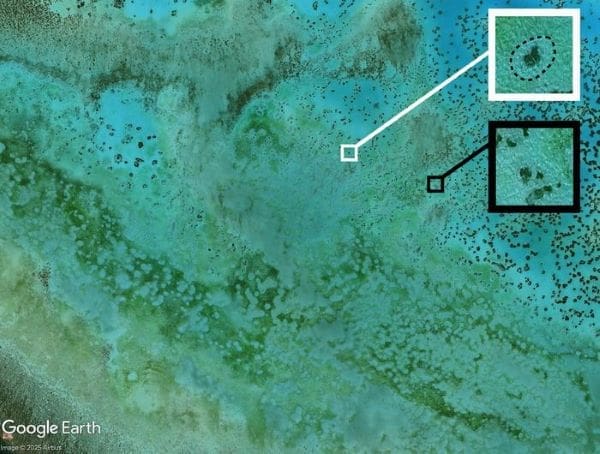
Prior studies have proposed that these and other halos may reflect what is known in ecology as the “landscape of fear” theory: fear of predation causes prey to alter their foraging behavior, which may result in the creation of halos marking where prey feel safe to eat.
But if fear creates halos, the researchers wanted to know why some reefs with sharks and other predators have halos while others don’t and why halos aren’t bigger where overfishing has removed many top predators.
A new study published in The American Naturalist, links grazing halo patterns in coral reefs, as well as those in other patchy habitats, to the spatial patterns of the shelter habitat itself. Given that halos only exist surrounding shelter habitat patches, the team wanted to examine how halos would look where coral are clustered versus dispersed across the seascape. As part of the analysis, the team also set out to determine if the halo patterns could be used to assess how healthy or stressed different reefs are.
They created two mathematical models to study the effect of shelter habitat clustering on halo patterns. Then, they used Heron Island in the Great Barrier Reef off Queensland, Australia, as a case study, applying satellite-imagery data from the coral reef system to test their model.
They selected Heron Island as it has been studied extensively. Plus, climate change is the biggest threat to the Great Barrier Reef due to coral bleaching events, ocean acidification, extreme weather events, and habitat changes.
In the first model, the team demonstrated how simple geometric rules describing how circles overlap determine the amount of vegetation cover expected when habitat patches are clustered or dispersed.
“If the shelter habitat is tightly packed in one space, then there’s not much room for nervous prey to explore and less vegetation to eat,” says lead author Theresa Ong, an assistant professor of environmental studies at Dartmouth. “But if shelter is more evenly distributed, the halos carve out more empty space in the landscape and their distinctive patterns disappear into one another as they overlap.” In other words, it’s harder to see an individual halo if there are many overlapping halos and no vegetation surrounding it.
The researchers designed their model to be general, so that it could be applied to any ecosystem where organisms graze near their habitat, such as a herd of cattle that grazes near trees in a pasture.
But that model is static and assumes that grazing remains constant over time, so the researchers developed a second model to examine how the dynamics between herbivores and vegetation may impact the presence and size of the halos.
The results revealed two scenarios. When the coral patches are dispersed, shelter from predators is also dispersed, which can lead to overgrazing. This, in turn, creates a cyclical system that oscillates between the presence and absence of vegetation. In other words, the halos in a reef may emerge and then disappear but reemerge again in due time.
When coral patches however, are densely clustered, resulting in limited shelter, the halos are more likely to remain stable.
In healthy reefs, predator populations tend to constrain herbivores from grazing but both stable and cyclic halo patterns are possible in these systems.
The authors say that tracking halo patterns over time may be more important than tracking sizes.

The team hypothesized that persistent halos should only really exist where herbivores are highly limited and shelter is clustered. “However, the presence of halos, and phenomenon of halos appearing and disappearing over time is actually consistent with the landscape of fear theory,” says Ong. “And that could explain why the link between halo widths and reef community health is weak.”
According to the co-authors the herbivores have to be limited from consuming all of the vegetation by something for static halos to occur; otherwise, fluctuations are likely. They say that this is pretty typical predator-prey dynamics: when herbivores consume everything, there is no food left and their population will crash, but then the vegetation and herbivores eventually recover, resulting in halos that grow, shrink, and disappear over time.
“Oscillating halos are not necessarily a sign of overfishing or poor reef health,” says Ong. “What’s more concerning is if static halos suddenly start cycling or if cyclic halos suddenly become static, which could indicate a major shift in system health and resilience.”
Conducting field research, including in the ocean and at coral reefs, is quite difficult, especially across a large area. Use of the satellite imagery provides researchers with the ability to examine potential research sites at a glance and obtain a rough idea of what’s happening to the health of a reef, which could be really valuable for conservation purposes.
“There are a lot of endemic species on reefs, especially on the Great Barrier Reef, which we could easily lose due to the compounding effects of climate change and overfishing, so gaining a better understanding of how halo patterns reflect reef community dynamics may be useful in reef conservation efforts,” says Ong. “Tracking halos over time may help us keep track of whether predator populations are intact and the reef is healthy.”
Lisa C. McManus at the University of Hawa’i at Manoa and Vitor V. Vasconcelos at the University of Amsterdam, Netherlands served as co-lead authors and Luojun Yang at Princeton University and Chenyang Su at Dartmouth, also contributed to the study.
Journal Reference:
Theresa W. Ong, Lisa C. McManus, Vítor V. Vasconcelos, Luojun Yang, and Chenyang Su, ‘Seeing Halos: Spatial and Consumer-Resource Constraints to Landscapes of Fear’, The American Naturalist (2025). DOI: 10.1086/735688
Article Source:
Press Release/Material by Dartmouth College
Featured image credit: Gerd Altmann | Pixabay


