Explore the latest insights from top science journals in the Muser Press daily roundup (August 14, 2025), featuring impactful research on climate change challenges.
In brief:
A new window into Earth’s upper atmosphere
- Harvard SEAS researchers have tested and validated lightweight nanofabricated structures that can passively float in the mesophere, which is about 45 miles above Earth’s surface.
- The devices levitate via photophoresis, or sunlight-driven propulsion, which occurs in the low-pressure conditions of the upper atmosphere.
- Such structures could be used for sensing and communication in an area of the atmosphere that’s been difficult to monitor with existing technology.
Between 50 and 100 kilometers (30-60 miles) above Earth’s surface lies a largely unstudied stretch of the atmosphere, called the mesosphere. It’s too high for airplanes and weather balloons, too low for satellites, and nearly impossible to monitor with existing technology. But understanding this layer of the atmosphere could improve the accuracy of weather forecasts and climate models.
A new study published in Nature by researchers at the Harvard John A. Paulson School of Engineering and Applied Sciences (SEAS), University of Chicago, and others introduces a novel way to reach this unexplored near-space zone: lightweight flying structures that can float using nothing but sunlight.
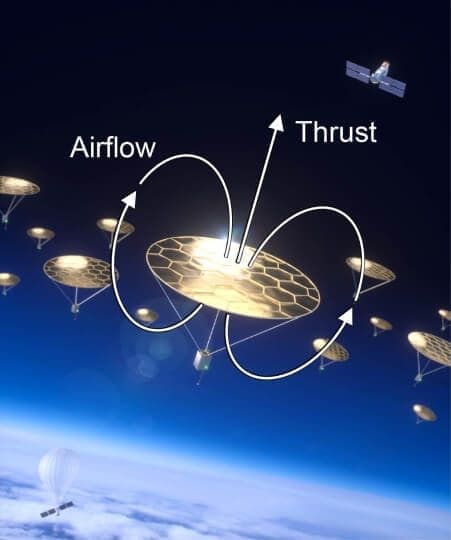
“We are studying this strange physics mechanism called photophoresis and its ability to levitate very lightweight objects when you shine light on them,” said Ben Schafer, lead author of the paper and a former Harvard graduate student in the research groups of Joost Vlassak, the Abbott and James Lawrence Professor of Materials Engineering at SEAS, and David Keith, now a professor at the University of Chicago.
How photophoresis works
Photophoresis occurs when gas molecules bounce more forcefully off the warm side of an object than the cool side, creating continuous momentum and lift. This effect only happens in extreme low-pressure environments, which are exactly the conditions found in the mesosphere.
The researchers built thin, centimeter-scale membranes from ceramic alumina, with a layer of chromium on the bottom to absorb sunlight. When light hits this structure, the heat difference between the top and bottom surfaces initiates a photophoretic lifting force, which exceeds the structure’s weight.
“This phenomenon is usually so weak relative to the size and weight of the object it’s acting on that we usually don’t notice it,” Schafer said. “However, we are able to make our structures so lightweight that the photophoretic force is bigger than their weight, so they fly.”
The concept originated more than a decade ago when Keith hypothesized different uses of photophoretic particles, including their potential to reduce climate warming. A collaboration began with then-graduate student Schafer, and Vlassak, an expert in nanofabrication and experimental mechanics, in order to help move the concepts from theory to reality.
The collaboration became feasible through recent advances in nanofabrication technology, which allow researchers to build low-mass, nanoscale devices with greater precision.
“We developed a nanofabrication process that can be scaled to tens of centimeters,” Vlassak said. “These devices are quite resilient and have unusual mechanical behavior for sandwich structures. We are currently working on methods to incorporate functional payloads into the devices.”
Testing devices in the lab
Using these fabrication methods, the research team created centimeter-scale structures and directly measured the photophoretic forces acting on them inside a low-pressure chamber Schafer and former Harvard postdoctoral fellow Jong-hyoung Kim built in Vlassak’s lab. They compared those results to predictions of how such structures would behave in the upper atmosphere. Device design and fabrication were led by Kim, who is now a professor at Pukyong National University in South Korea.
“This paper is both theoretical and experimental in the sense that we reimagined how this force is calculated on real devices and then validated those forces by applying measurements to real-world conditions,” Schafer said.
A key experiment detailed in the paper shows a 1-centimeter-wide structure levitating at an air pressure of 26.7 Pascals when exposed to light at just 55% the intensity of sunlight. This pressure condition models what’s found 60 kilometers above the Earth’s surface.
“This is the first time anyone has shown that you can build larger photophoretic structures and actually make them fly in the atmosphere,” said Keith. “It opens up an entirely new class of device: one that’s passive, sunlight-powered, and uniquely suited to explore our upper atmosphere. Later they might fly on Mars or other planets.”
Possible applications: Sensing, communication, Martian exploration
The team envisions a range of possible applications for their new device, especially in climate science. If equipped with lightweight sensors, this device could collect key data like wind speed, pressure, and temperature from a region of the atmosphere that has long remained a blind spot. This data is critical for calibrating the climate models that build the foundation of weather forecasting and climate change projections.
Other potential applications include telecommunications for defense and emergency response scenarios. Using a fleet of these devices could enable a floating array of antennas with data transmission capabilities comparable to low orbit satellites like Starlink, but with lower latency due to their closer proximity to the ground.
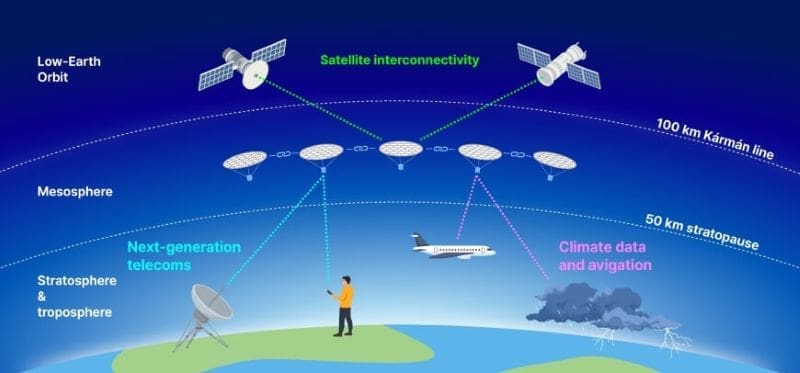
Since Earth’s upper atmosphere shares key characteristics with the thin atmosphere of Mars, the device could facilitate new modes of planetary exploration and communication in that environment as well.
The team’s next step is to integrate onboard communications payloads that would allow the device to transmit real-time data during flight.
“I think what makes this research fun is that the technology could be used to explore an entirely unexplored region of the atmosphere. Previously, nothing could sustainably fly up there,” Schafer said. “It’s a bit like the Wild West in terms of applied physics.”
Research described in the paper formed the building blocks of a Harvard spinoff company, Rarefied Technologies, that Schafer and co-founder Angela Feldhaus launched in 2024. Harvard Office of Technology Development provided business development support to the research team and licensed the innovations to Rarefied Technologies for further development.
***
The research was supported by the Star-Friedman Challenge for Promising Scientific Research at Harvard. It had federal support from the Harvard University Materials Research Science and Engineering Centers (DMR-2011754), funded by the National Science Foundation. The devices were fabricated at the Harvard Center for Nanoscale Systems, also supported by NSF (ECCS Grant No. 1541959).
Journal Reference:
Schafer, B.C., Kim, Jh., Sharipov, F. et al., ‘Photophoretic flight of perforated structures in near-space conditions’, Nature 644, 362–369 (2025). DOI: 10.1038/s41586-025-09281-8
Article Source:
Press Release/Material by Harvard John A. Paulson School of Engineering and Applied Sciences (SEAS)
Optimization of key land surface albedo parameter reduces wet bias of climate modeling for the Tibetan Plateau
As the world’s highest plateau, the Tibetan Plateau receives intensified summer solar radiation due to its high altitude and low air density. This creates low-pressure systems and cyclonic circulation in the lower atmosphere, driving monsoon water vapor into the plateau’s interior from its eastern and southern boundaries. Accurate representation of land surface heat source is crucial for reliable climate predictions.

Surface albedo, a key factor in land surface energy balance, is typically parameterized in climate models using a “soil color” parameter, where darker soils (higher values) correspond to lower albedo, and vice versa. However, uncalibrated global “soil color” parameter in the climate models have led to underestimated summer surface albedo on the Tibetan Plateau, contributing to overestimated precipitation.
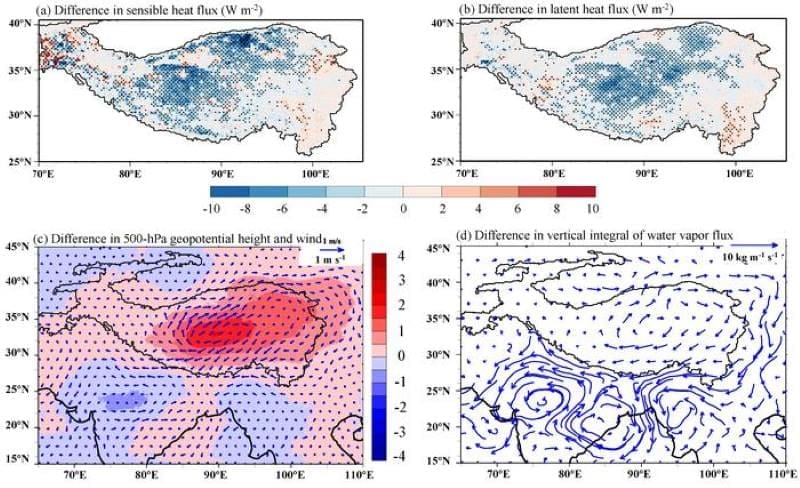
Researchers from the National Institute of Natural Hazards (Ministry of Emergency Management of China), Southwest University, Tsinghua University, and Institute of Tibetan Plateau Research (Chinese Academy of Sciences), introduced an optimized “soil color” map into the Weather Research and Forecasting model, enhancing land surface albedo and temperature simulations in the plateau over a 10-year period from 2011 to 2020.
This weakened land-atmosphere interactions, reducing sensible heat and evapotranspiration. Such adjustments increased lower tropospheric geopotential height, suppressing moisture flux convergence, and limiting water vapor flow into the plateau. Consequently, the wet bias in precipitation estimates dropped from 52% to 36% as compared to the IMERG precipitation product, with improved accuracy over 66% of rain gauge stations. The study further revealed that the reduction in moisture flux convergence contributes about 77% to the summer precipitation decrease.

The study demonstrates that underestimating surface albedo partially contributes to the wet bias in precipitation simulation and highlights the potential of optimizing land surface parameters using cost-effective satellite remote sensing to improve climate modeling.
Journal Reference:
Ma, X., Zhao, L., Sun, J. et al., ‘Optimization of key land surface albedo parameter reduces wet bias of climate modeling for the Tibetan Plateau’, Science China Earth Sciences 68, 2653–2662 (2025). DOI: 10.1007/s11430-025-1635-0
Article Source:
Press Release/Material by Science China Press
Natural archives in coral skeletons show sea-level rise began accelerating earlier than previously thought
A groundbreaking international study by marine scientists based in Singapore has revealed that sea-level rise in the Indian Ocean began accelerating far earlier than previously thought, with corals providing an unbroken natural record of ocean change stretching back to the early 20th century.
Published in Nature Communications, the study was led by Professor Paul Kench from the Department of Geography, at the National University of Singapore’s (NUS) Faculty of Arts and Social Sciences, in collaboration with researchers from NUS and Nanyang Technological University (NTU).
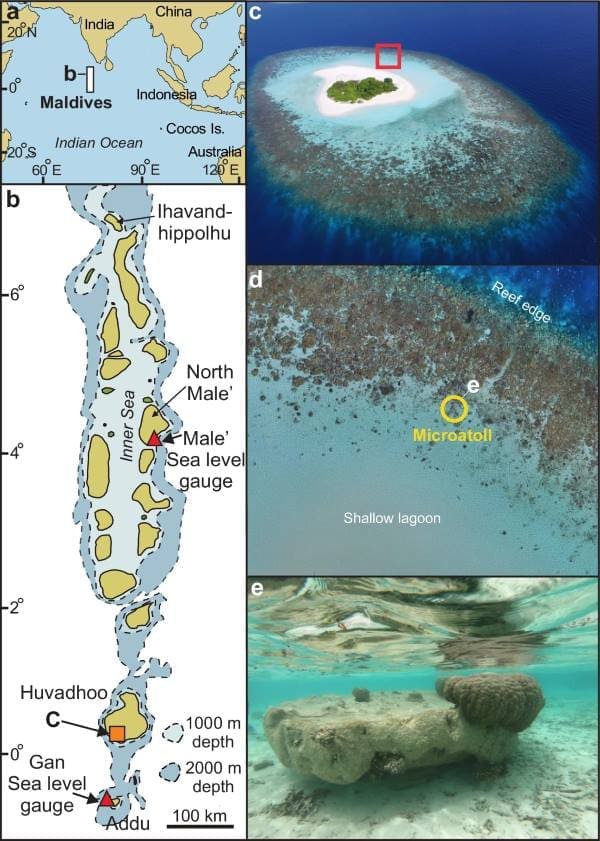
By analysing coral samples from the Maldives in the central Indian Ocean, the scientists reconstructed a century-long chronology of sea-level changes and climate shifts with remarkable precision.
They were able to extend the sea-level record for the Indian Ocean back a further 60 years, all the way to the early 1900s, offering a much longer and clearer historical context for interpreting modern sea-level changes.
The study yielded two significant findings.
The first is the pronounced acceleration of rising sea levels in the Indian Ocean from around 1959 – earlier than indicated by coastal tide gauges or satellite observations. The timing aligns closely with global temperature increases and accelerated glacial melt driven by human activity, showing that the Indian Ocean has been highly responsive to climatic changes for over half a century.
The second is that sea levels in the Indian Ocean, which covers approximately 30% of the world’s ocean area and supports around 30% of the global population, have risen significantly by 30 cm since the middle of the 20th century.
“What we’re seeing is a clear fingerprint of human-driven climate change etched into the skeletons of corals. The early acceleration in sea-level rise is a warning sign that the ocean has been responding to global warming far earlier and more strongly than we thought,” said Prof Kench.
Accelerating sea-level rise threatens millions living in coastal areas with increased flooding, erosion, saltwater intrusion, and damage to vital ecosystems like mangroves and coral reefs.
The effects of sea-level changes in the Indian Ocean ripples beyond Asia to the rest of the world, underscoring the need for international cooperation to address global challenges such as water security, agriculture, and disaster preparedness.
For Singapore and its Southeast Asian neighbours, the uncovering of long-term patterns of sea-level changes can improve climate models and strengthen the region’s ability to plan for future risks under continued global warming.
For example, the new coral-derived data from the study offers a historical baseline that can enhance the efforts that Singapore already has in place to guard against rising sea levels, such as the Coastal-Inland Flood Model and Climate Impact Science Research Programme, by improving the accuracy of sea-level projections and informing adaptive strategies.
Corals confirmed as trusted recorders of sea-level and climate history
This research sets a new standard for how scientists can use coral to look back in time and understand how our oceans have changed.
As corals grow, they build their skeletons layer by layer similar to how trees form rings. Each layer captures details about the ocean at that time, such as temperature, salt levels, and even sea level.
To make sure data from the coral samples from the Indian Ocean that were analysed was reliable, the team compared it with real sea-level measurements from tide stations and satellites, and found that they matched up closely.
The successful calibration of coral proxies against instrumental sea-level records means that we can trust corals to tell us about past sea-level changes, with their coral growth rates validated to be reliable indicators of relative sea-level changes, making them a powerful tool for climate research.
In addition to tracking long-term sea-level changes, the coral records also captured signs of extreme climate events such as unusual warming and cooling periods, as well as droughts. These signals closely match historical weather records, offering valuable insight into the frequency and severity of past climate extremes.
Prof Kench said: “These findings have far-reaching implications for climate adaptation planning globally, especially for low-lying and densely populated coastal regions. We hope this work contributes meaningfully to the global dialogue on resilience and preparedness.”
This pioneering research deepens our understanding of how oceans respond to climate change, while setting a new standard for using natural archives to reconstruct environmental history. As coastal nations around the world confront the realities of rising seas, the insights uncovered by Singapore’s marine scientists offer both a clearer view of the past and a critical guide for planning a more resilient future.
Journal Reference:
Kench, P.S., Morgan, K.M., Owen, S.D. et al., ‘Coral growth records 20th Century sea-level acceleration and climatic variability in the Indian Ocean’, Nature Communications 16, 5872 (2025). DOI: 10.1038/s41467-025-60972-2
Article Source:
Press Release/Material by National University of Singapore (NUS)
Can extremely high-temperature weather forecast oil prices?
As crude oil becomes increasingly influenced by market dynamics, fluctuations in its price have a significant effect on the global economic and financial landscape (Naser, 2016). Accurate forecasts of crude oil prices play a crucial role in providing scientific support for energy-intensive enterprises and helping investors optimize their portfolios to effectively manage risks (Tian et al., 2023; Zhang and Wang, 2022).
To develop precise projections, it is essential to uncover the underlying factors driving fluctuations in crude oil prices. Previous research has indicated that the long-term trend of oil prices is determined by market supply and demand fundamentals (Dées et al., 2007; Hamilton, 2009), whereas short-term volatility may be affected by external factors such as stock performance (Bouri et al., 2022), exchange rates (Sun et al., 2022), and investor sentiment (Dai et al., 2022a).
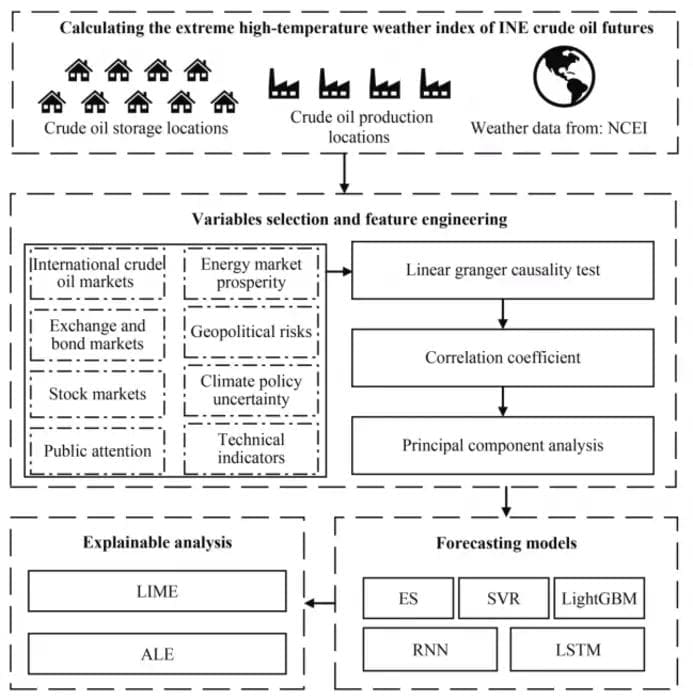
The increasing occurrence of extreme weather events in recent years has increased the vulnerability of oil products to climate-related risks (Cruz and Krausmann, 2013; Wen et al., 2021; Tumala et al., 2023), including the impact of global warming caused by the greenhouse effect (Kweku et al., 2018; Zhang et al., 2024). The demand for crude oil and other fossil fuels tends to rise during periods of extreme hot weather (van Ruijven et al., 2019).
Moreover, elevated temperatures can disrupt operations at drilling and refinery sites (Yalew et al., 2020; Qui et al., 2023) and pose challenges to the integrity of oil transportation infrastructure, such as pipelines (Izaguirre et al., 2021), potentially affecting the oil supply. Consequently, stakeholders in oil markets must consider extremely high temperatures when assessing market conditions and making pricing decisions. However, existing research on crude oil forecasting has not adequately considered extremely high weather conditions.
Although recent studies have highlighted the importance of extreme weather information in predicting crude oil prices (Xu et al., 2023), their reliance on media reports introduces subjective bias. Microscale meteorological observations have the potential to provide oil market managers with precise weather information (Katopodis and Sfetsos, 2019). The study’s objective is to contribute additional empirical evidence regarding the relationship between extreme weather events and oil price forecasts by utilizing precise meteorological data from storage and supply locations in specific target oil markets.
There are two primary types of models used for forecasting oil prices.
The first type consists of traditional statistical models, such as exponential smoothing (ES) (Azevedo and Campos, 2016; He, 2018), the autoregressive integrated moving average (ARIMA) (Xiang and Zhuang, 2013; Zhao and Wang, 2014), and vector autoregression (VAR) models (Baumeister and Kilian, 2014). However, these models face challenges in capturing the inherent nonlinearity in oil price dynamics (Gao and Lei, 2017).
The second category of methodologies comprises emerging machine learning models (Zhao et al., 2017), which are primarily represented by support vector regression (SVR) (Wang et al., 2020), recurrent neural networks (RNNs) (Chaitanya Lahari et al., 2018), and long short-term memory (LSTM) models (Güleryüz and Özden, 2020).
These models have advantages in characterizing the nonlinear relationship between influencing factors and crude oil prices, and they offer effective forecasting accuracy (Öztunç Kaymak and Kaymak, 2022). However, machine learning models are commonly perceived as enigmatic black boxes, as they present challenges in providing users with a comprehensive understanding of their predictive mechanisms.
The advent of explainable machine learning methods has offered a valuable tool for elucidating how factors drive predictive outcomes, and their application has expanded into research fields such as forecasting bitcoin prices (Goodell et al., 2023) and energy consumption (Aras and Hanifi Van, 2022). Nevertheless, these explainable methods have not yet been applied in crude oil price forecasting research.
Considering the aforementioned limitations, this research makes three significant contributions to the current literature.
First, we develop an extremely high-temperature weather index (HTI) based on daily meteorological data specific to the crude oil production and storage sites of the China International Energy Exchange (INE). Unlike previous indices that broadly describe the frequency of extreme weather events on a global or national scale (Guo et al., 2023a) or those derived from textual reports on extreme weather attention (Xu et al., 2023), our HTI provides a finer scale to present extreme high-temperature weather information for INE crude oil price prediction.
Second, our study confirms that including the HTI as a predictive factor enhances the accuracy of INE crude oil futures price prediction in terms of errors and trend changes. In fact, the out-of-sample predictive contribution of the HTI even surpasses several common indicators, such as the stock market index, in most instances. As the HTI value increases, a corresponding rise in the predicted INE crude oil futures price is observed.
Third, we introduce explainable methods to improve the credibility of machine learning models in the crude oil prediction process, overcoming the inherent deficiencies of previous black box models. This enables us to gain deeper insights into the correlation between varying degrees of extreme heat and crude oil price dynamics.
The remainder of the paper is organized as follows: Section 2 introduces the methodology. Section 3 describes the data. Section 4 presents our results. Finally, Section 5 provides concluding remarks.
Journal Reference:
Zha, D., Zhang, S. & Cao, Y., ‘Can extremely high-temperature weather forecast oil prices?’, Frontiers of Engineering Management 12, 529–542 (2025). DOI: 10.1007/s42524-025-4075-5
Article Source:
Press Release/Material by Higher Education Press
Featured image credit: Gerd Altmann | Pixabay


