Explore the latest insights from top science journals in the Muser Press roundup (November 13, 2025), featuring impactful research on climate change challenges.
In brief:
A significant amount of dissolved organic carbon in the Arctic Ocean comes from land
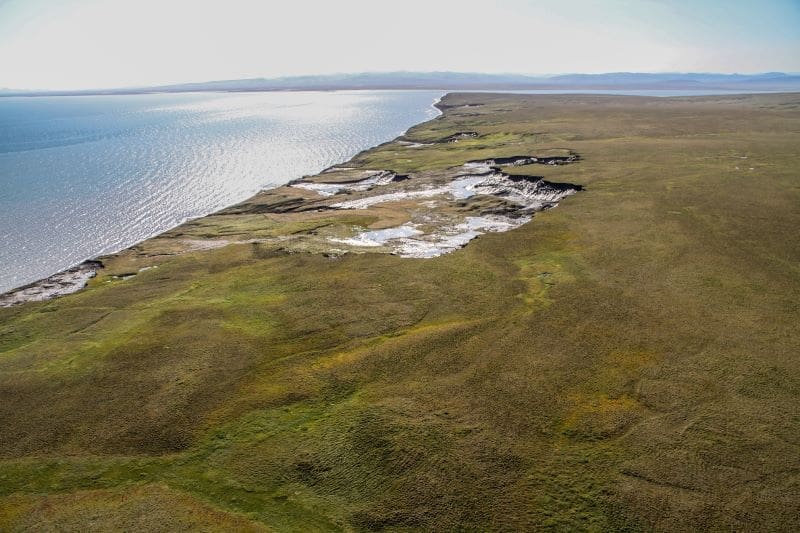
Climate change and the associated rising temperatures are melting more and more frozen ground in the Arctic. This dissolved matter contains large amounts of organic carbon which is flowing into the central Arctic ocean. In a new study, scientists led by Alfred-Wegener-Institute quantified how much terrestrial organic matter accumulates in the central Arctic Ocean. Using chemical fingerprints, they were able to assess how fast it degrades, thus releasing additional CO₂ to the ocean. These findings are an important basis to project how inputs from land affect Arctic marine ecosystems and the ability of the ocean to store CO₂ in a warming climate.
The results are published in the journal Nature Geoscience.
When permafrost thaws in the Arctic, it releases very old organic matter from plants, microorganisms or animals, containing carbon that was frozen in the soil for hundreds or thousands of years. Rivers transport this material into the Arctic Ocean, where it dissolves and turns into “dissolved organic matter (DOM).”
“This matter constitutes a large reservoir of organic carbon in the ocean, rivalling the amount of atmospheric CO₂ in scale,” says Dr. Xianyu Kong, scientist at Alfred Wegener Institute, Helmholtz Centre for Polar and Marine Research (AWI) and first author of the study. “Compared to most other oceans, the Arctic Ocean receives more freshwater and a disproportionally large amount of terrestrial organic matter from extensive inputs from permafrost thaw, river discharge, and coastal erosion.”
Together with German, Norwegian and Danish colleagues, the AWI scientist has now quantified, how much organic carbon is accumulated in the central Arctic Ocean. “Our study reveals that about 16 percent of all dissolved organic carbon here originates from land, much of it persisting even in deep waters, where we surprisingly found a consistently high terrestrial contribution,” says Xianyu Kong. “This suggests that some of land-derived organic matter is chemically stable enough to survive long transport and move from the central Arctic ocean to the North Atlantic Deep Water. This connects Arctic processes with the global carbon cycle.”
Terrestrial dissolved organic carbon is also transported in surface waters: The so-called Transpolar Drift is a surface current that transports freshwater, sea ice as well as nutrients across the Arctic Ocean towards the North Atlantic. The amount of organic carbon in regions that are affected by the Transpolar Drift was about twice as high in neighboring regions. From this, the research team estimated that around 39 million tons of terrestrial carbon are transported from the Arctic to the Atlantic every year.
Map shows terrestrial dissolved organic carbon in the Arctic Ocean
DOM from terrestrial sources impacts the organic carbon cycle in the Arctic Ocean by changing light attenuation, nutrient availability, or microbial processes. “Previous studies show that the concentration of dissolved organic carbon increases in freshwater environments as a response to climate change,” says Prof. Boris Koch, co-author of the study and chemical oceanographer at AWI. “For the Arctic Ocean, however, there is no data available that shows similar trends, partly due to the lack of appropriate methods.”
With their results, the AWI researchers are filling a knowledge gap in the understanding of how much carbon enters the Arctic Ocean from land, how it is distributed, and how it changes in the ocean.
“As Arctic warming accelerates, inputs of terrestrial organic matter are expected to increase, potentially altering carbon cycling and broader biogeochemical processes in the Arctic Ocean,” says Xianyu Kong. Previous climate models do not yet reflect these findings. “These findings are an important basis for predicting how inputs from land affects Arctic marine ecosystems and the Arctic carbon inventory in a warming climate.”
For the analysis, the researchers, in collaboration with the Helmholtz Centre for Environmental Research (UFZ), developed a new analytical approach over several years to analyze seawater samples from across the central Arctic Ocean that they have collected during the MOSAiC expedition in 2019 /2020. To measure the organic compounds in the samples, they used ultrahigh-resolution Fourier-transform mass spectrometry (FT-ICR MS).
“This method allowed us to identify and quantify thousands of individual organic molecular formulas in seawater and distinguish whether they originated from the ocean and sea ice or terrestrial sources,” says Xianyu Kong. “We were not only able to quantify the concentration of terrestrial carbon, but also to estimate how far the degradation of the organic material has already progressed.” Using this method, the researchers were able to produce the first depth-resolved map of dissolved terrestrial organic carbon in the Arctic Ocean.
Journal Reference:
Kong, X., Lechtenfeld, O.J., Kaesler, J.M. et al., ‘Major terrestrial contribution to the dissolved organic carbon budget in the Arctic Ocean’, Nature Geoscience (2025). DOI: 10.1038/s41561-025-01847-5
Article Source:
Press Release/Material by Alfred Wegener Institute, Helmholtz Centre for Polar and Marine Research (AWI)
How climate change brings wildlife to the yard
As climate change increases the frequency of droughts, UCLA and UC Davis researchers found one overlooked side effect: People report more conflicts with wildlife during drought, when resources are scarce.
For every inch that annual rainfall decreases, scientists found a 2 % to 3 % increase in reported clashes with a variety of carnivores during drought years, according to a paper published in the journal Science Advances.
The researchers pored through seven years of data from the Wildlife Incident Reporting database, run by the California Department of Fish and Wildlife. The results are likely broadly applicable outside of California, said lead author Kendall Calhoun, a postdoctoral researcher and conservation ecologist affiliated with both UCLA and UC Davis.
“Climate change will increase human-wildlife interactions, and as droughts and wildfires become more extreme, we have to plan ways to coexist with wildlife,” said Calhoun, a member of Justine Smith’s lab at UC Davis and of UCLA’s Tingley lab on ecology and conservation. “Animals coming into human spaces are generally framed as wildlife trying to take resources from humans, but it’s often because we’ve taken the resources away from the wild areas.”
Wildlife interactions don’t increase with all animals during droughts, but four animals stood out in the data. Across all ranges of precipitation, for every 1-inch decrease in annual rainfall, the researchers found reported conflicts increased:
- 2.1% for mountain lions;
- 2.2% for coyotes;
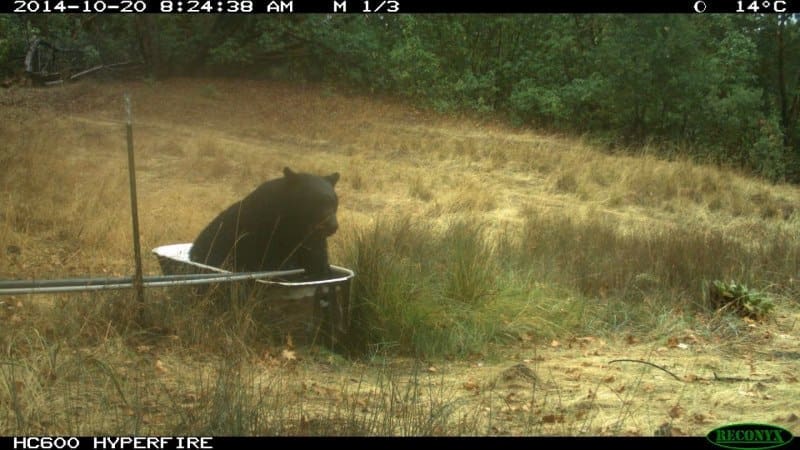
- 2.6% for black bears;
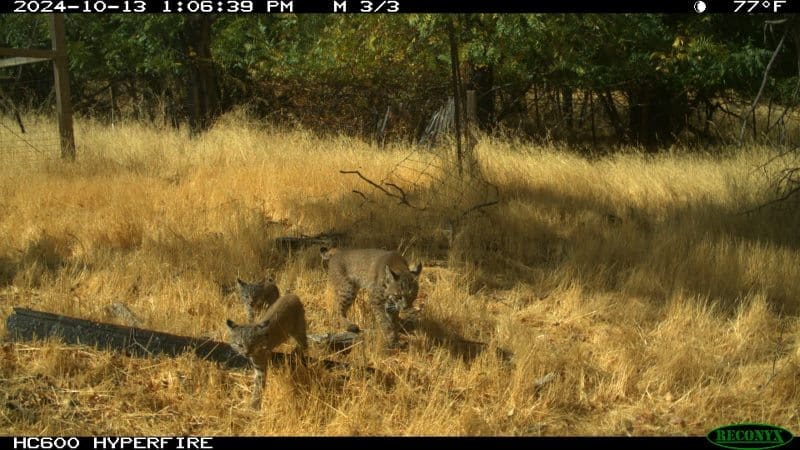
- 3% for bobcats.
But what counts as a conflict?
“That’s the big question, and it often depends on the person reporting it,” Calhoun said. “If you have birds in an agricultural area, they could provide ecosystem services like eating harmful insects, or they could be raiding the crops. One person might have sympathy for wildlife grazing from their tomato garden, while another person might call it property damage.”
Actual attacks on people are exceedingly rare and not included in the same database, Calhoun explained. In the study, the researchers analyzed reports to the California Department of Fish and Wildlife highlighting property damage and “nuisances,” rather than reports categorized as lower-level “concerns” or “sightings.”
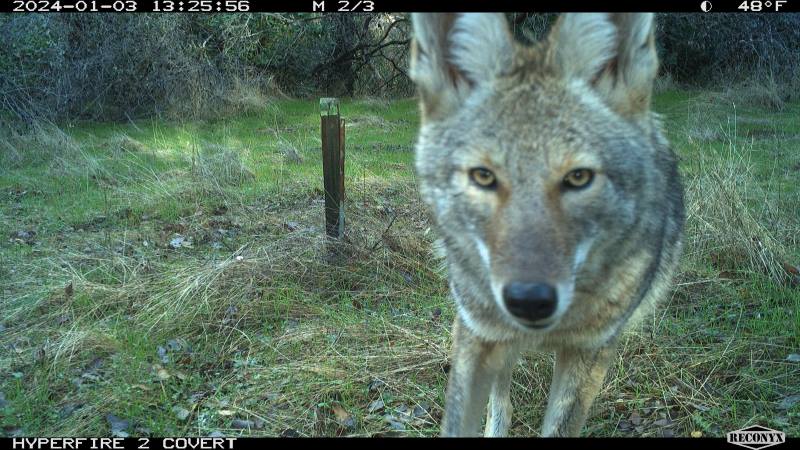
So are there more coyotes moving through urban areas during droughts? It’s hard to say, Calhoun said.
“It’s unclear whether the number of reports increases because there are subjectively more conflicts, or because people perceive wildlife more negatively when their own resources are more stressed,” he said. “Regardless, it’s clear that climate change will mean more conflict between humans and animals if we don’t create more climate-resilient landscapes for wildlife.”
Studies have shown the benefits of creating such safe zones and other refuges for wildlife. Calhoun anticipates that the resources in those areas could dissuade animals from venturing into more human-dominated spaces.
“Now that we know how droughts make wildlife interactions worse, why couldn’t we make them better?” he said. “Mitigating how much water we take out of natural landscapes could mitigate conflict.”
There are few comprehensive databases collecting community-reported wildlife incidents, making the CDFW database used for the study a rare and valuable resource, Calhoun noted, without which his research could not succeed. It’s an important example of community-driven science, Calhoun said.
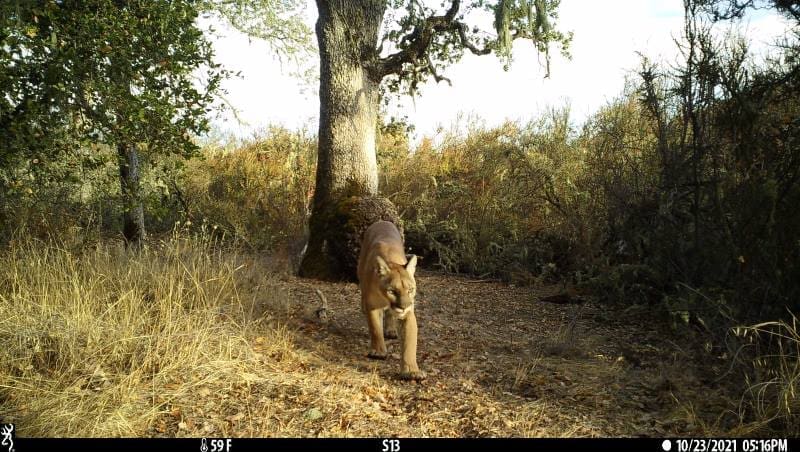
Calhoun’s research expertise focuses on megafires, and how climate-change driven fire trends influence animal habitats. Animals can often flee the fire itself, but to find food, water and shelter, they have to move into areas protected from the flames – and that often means into human-inhabited areas, Calhoun said.
“I look at ways to improve human-wildlife interactions, and climate change is going to make that path more difficult,” Calhoun said. “But if we can make it worse, then we can make it better. People just need to be invested in their local environment to make conservation work.”
Journal Reference:
Kendall L. Calhoun,Justine A. Smith, Morgan W. Tingley et al., ‘Human-wildlife conflict is amplified during periods of drought’, Science Advances 11, (46): eadx0286 (2025). DOI: 10.1126/sciadv.adx0286
Article Source:
Press Release/Material by University of California – Davis (UC Davis)
Rainfall and temperature shape mosquito fauna in Atlantic Forest bromeliads, including malaria vectors
The transmission of malaria by the Anopheles cruzii mosquito in the South and Southeast of Brazil was so alarming in the 1940s – with approximately 4,000 cases per 100,000 people – that the disease became known as bromeliad malaria. This is because the Kerteszia subgenus of the mosquito, which transmits the disease in the Atlantic Forest, develops only in bromeliads, plants that accumulate water and maintain conditions favorable for the development of this and other species.

Although malaria is now a minor concern in the region, it still has epidemiological importance. There were 77 confirmed cases in the state of São Paulo alone between 2017 and 2024. Therefore, understanding the life cycle of the vectors and the conditions necessary for their survival is essential to preventing the disease from ravaging this part of Brazil as well, since it is endemic in the Amazon.
In a study published in the journal Scientific Reports, a group led by researchers from the University of São Paulo’s School of Public Health (FSP-USP) monitored the presence of larvae in bromeliads in the Capivari-Monos Environmental Protection Area (APA) for two years.
The results indicate that rainfall and temperature directly affect the volume of water accumulated in the bromeliad tanks. This volume, in turn, modifies the physical and chemical characteristics of the water, such as pH and dissolved oxygen. These changes can influence which species of mosquitoes can develop inside the plants and in what quantities. The data may be useful for future epidemiological studies and for predicting possible disease outbreaks.
“There are studies that point to a change in malaria transmission patterns as a consequence of climate change. In these projections, some regions of East Africa and South America would become more prone, while current endemic areas could experience declines in rates due to excessive warming. For these and other reasons, it’s necessary to understand the factors that contribute to the success of vectors,” says Antonio Ralph Medeiros de Sousa, the first author of the study and a researcher at FSP-USP who received a scholarship from FAPESP.
The work also received support from the Foundation through two projects coordinated by Mauro Toledo Marrelli, a professor at FSP-USP: “Investigation of the climatic and landscape variations effects on the vectors and on the spatial and temporal dynamics of sylvatic yellow fever and autochthonous malaria in fragments of the Atlantic Forest in the State of São Paulo, Brazil” and “Biodiversity of mosquitoes (Diptera: Culicidae) in Cantareira State Park and the Capivari-Monos environmental protection area, State of São Paulo”. The latter project was funded through FAPESP’s Research Program on Biodiversity Characterization, Conservation, Restoration and Sustainable Use (BIOTA).
Data
The data were collected from 2015 to 2017 during Sousa’s doctoral studies. During this period, the researcher visited the same nine bromeliad specimens at three points in the Capivari-Monos Environmental Protection Area in the Parelheiros neighborhood in the southernmost part of the municipality of São Paulo.
During each of the ten collections, the amount of water accumulated by each plant was measured, as well as the pH, salinity, and dissolved oxygen levels. Larvae from the present mosquitoes were collected. Later, in the laboratory, the larvae were developed, and the species, or when this was not possible, the genus of each mosquito, was identified. The dataset also included rainfall and maximum and minimum temperatures in the 30 days prior to collection.
The researchers analyzed the data using statistical models that tested a cascade effect, in which an initial disturbance (variation in rainfall and/or temperature) affects other components in a sequence of connected processes. First, they analyzed the effect of accumulated rainfall and average monthly temperature on the volume of water stored in bromeliads. Then, they examined the relationship between volume and variations in the physical and chemical properties of the water, such as pH, salinity, and dissolved oxygen.
Next, they investigated the relationship between these parameters and the occurrence, richness, and abundance of mosquitoes in bromeliads, considering only species that occurred five or more times during the study period. Finally, they explored the direct and indirect effects of precipitation and temperature on physical-chemical parameters and mosquito fauna.
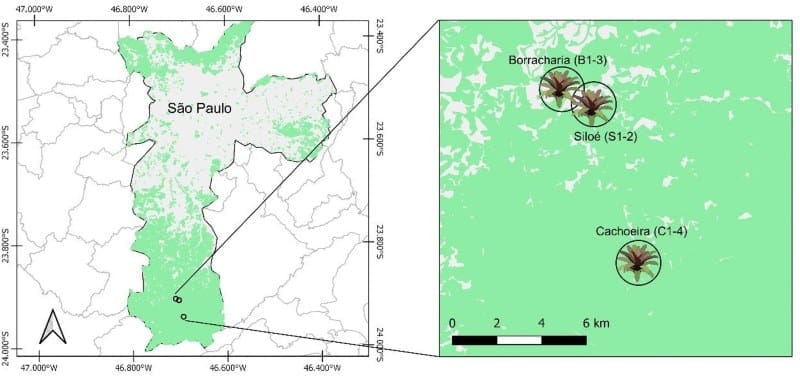
A total of 523 individuals belonging to 23 species were collected, including Anopheles cruzii, a malaria vector; Culex; and Wyeomyia. The latter two genera are not involved in disease transmission cycles, but their bites can cause discomfort when they are abundant. Each bromeliad contained between seven and 15 species, only ten of which occurred five or more times throughout the study.
The richness and abundance of mosquitoes varied in relation to pH, salinity, and the interaction between these two parameters. In general, pH was the parameter most associated with the presence of five of the ten species tested, including the malaria vector.
“In a scenario of changing rainfall and temperature patterns, there may be an increase in the abundance of the malaria vector, with consequences for public health. However, it’s important to remember that Anopheles cruzii is wild, unlike the dengue vector, Aedes aegypti, which is urban. Therefore, the way to deal with it is different,” Sousa points out.
The researcher refers to control measures since insecticides cannot be used, as with the dengue, Zika, and chikungunya vectors, nor can bromeliads be uprooted, as was done during past malaria outbreaks in the Southeast to control mosquitoes.
On the other hand, it is important to consider the natural controls of mosquitoes in the wild, such as predation and competition with other species. “Perhaps the effect of the increase in Anopheles isn’t as drastic as it’d be for an urban species,” the researcher notes.
Nevertheless, it is important to understand and monitor mosquitoes because malaria in the Atlantic Forest may be zoonotic, meaning it can infect non-human primates, such as howler monkeys. These monkeys can then infect mosquitoes that could transmit the disease to humans.
While the study does not suggest an imminent risk of malaria spreading, it sheds light on how the environment influences vector populations. This knowledge is essential for predicting possible future scenarios, especially in the context of climate change.
“Climate change, urban expansion, deforestation, and biodiversity loss are all factors that could interfere with transmission dynamics in the future. That’s why it’s important for public authorities to be vigilant,” the researcher concludes.
Journal Reference:
Medeiros-Sousa, A.R., de Oliveira-Christe, R., Ceretti-Junior, W. et al., ‘Linking abiotic conditions to mosquito assemblage structure in bromeliads’, Scientific Reports 15, 30308 (2025). DOI: 10.1038/s41598-025-15514-7
Article Source:
Press Release/Material by André Julião | Fundação de Amparo à Pesquisa do Estado de São Paulo (FAPESP)
Hourly weather data reveals climate trends in U.S.
In a new study, researchers from North Carolina State University found that over the past four and a half decades, areas in the northeastern U.S. have lost almost 1 1/2 weeks of temperatures below freezing, while portions of some states in the Gulf and Southwest have gained almost 1 1/2 weeks of temperatures that cause heat stress. The data can be used to inform climate adaptation planning.
“One of the challenges when talking about and planning for climate change is that the average change seems too small to be significant,” says Sandra Yuter, Distinguished Professor of Marine, Earth and Atmospheric Sciences at NC State and corresponding author of the study. “Two or three degrees doesn’t make much difference if your average daily temperature is 65 degrees Fahrenheit (18.3 °C). But it can make a huge difference if your typical temperature was 30 °F (-1.1 °C) and that increases to 33 °F (0.6 °C).”
The research team looked at hourly weather station data obtained from the National Centers for Environmental Information’s Integrated Surface Database Lite – which contains data from 340 weather stations in the contiguous U.S. and southern Canada – from 1978 to 2023. For each station, they computed decadal trends in hours below the freezing point (0 degrees Celsius, 32 °F) and hours above the threshold for heat stress in animals and plants (30 °C, 86 °F).
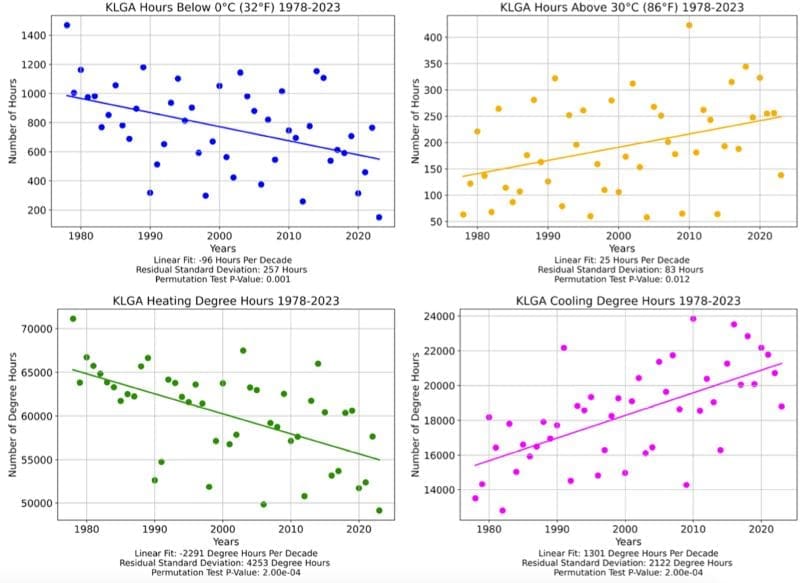
“The length of time that temperatures exceed thresholds like the one for heat stress is important,” Yuter says. “Maximum temperatures of 90 °F (32 °C) recorded for six hours over the course of a day will have substantially different impacts on people, animals, plants and buildings compared to the same maximum temperature recorded for only one hour of a day.”
Overall, they found that the most dramatic impacts were in the northeastern U.S. during winter. Many weather stations east of the Mississippi River and north of the 37th parallel have lost the equivalent of about 1 1/2 to 2 weeks of temperatures below 32 °F (0 °C).
They also found that locations in Arizona, New Mexico, and parts of southern Nevada, southern California and southern Texas have gained the equivalent of about 1 1/2 weeks of temperatures higher than 86 °F (30 °C), a threshold at which agricultural crops and animals start to experience heat stress symptoms.
Some areas, such as the Midwest, showed no significant trends due to the high variability of temperatures from year to year.
The researchers hope that the data can help policymakers, businesses, and homeowners justify and plan climate adaptations.
“Our main aim with this analysis is to explain how climate change is occurring in a manner that aligns with lived experiences so that people can understand it and take pragmatic action to adapt,” Yuter says. “The U.S. is a big country, so changes will look different depending on your region, but the work demonstrates that hourly temperature data is potentially useful in determining where there will be effects on ecological patterns and organism behaviors, energy usage, and growing season duration across the country.”
The work appears in PLOS Climate and was supported by the NC State University Provost Professional Experience Program, the National Aeronautics and Space Administration (80NSSC19K0354), the Office of Naval Research (N00014-21-1-2116 and N00014-24-1-2216), and the Robinson Brown Ground Climate Study donation fund. Former NC State undergraduate student Logan McLaurin is first author. Other NC State contributors include former Ph.D. student Kevin Burris and Senior Research Scholar Matthew Miller.
Journal Reference:
McLaurin L, Yuter SE, Burris K, Miller MA, ‘The power of hourly weather data: Observed air temperature climate trends for pragmatic decision-making’, PLOS Climate 4 (11): e0000736 (2025). DOI: 10.1371/journal.pclm.0000736
Article Source:
Press Release/Material by Tracey Peake | North Carolina State University
Featured image credit: Gerd Altmann | Pixabay


