Explore the latest insights from top science journals in the Muser Press daily roundup (October 31, 2025), featuring impactful research on climate change challenges.
In brief:
Detailed map of US air-conditioning usage shows who can beat the heat – and who can’t
A researcher at the University of Kansas has produced the most comprehensive and detailed map of air conditioning usage in the United States – data that can improve the understanding of AC access for public health officials, urban planners, emergency managers, economists, energy auditors, providers of social services, private industry and other stakeholders.
The research appears today in the peer-reviewed journal Scientific Data.
“This paper was about developing a nationwide air conditioning dataset,” said lead author Yoonjung Ahn, assistant professor of geography & atmospheric science at KU. “In the past, many studies have tried to estimate air conditioning ownership, but available public datasets were too limited. For example, the American Housing Survey provides data only at broad geographic levels, such as counties or metropolitan areas, and only for surveyed locations. Other sources, like the Energy Information Administration, collect small samples rather than data for the full population.”
Ahn uses spatial modeling, spatial analysis, spatial statistics and big data to research disproportional impacts of environmental hazards, like heatwaves.

“This dataset is important for understanding how people experience extreme heat as the climate warms,” she said. “Even though 90 % of Americans have some kind of AC, not all systems are equally effective. Portable or evaporative units, for example, don’t cool homes well in humid regions.”
Until now, detailed data on types of AC in use by people across the country hasn’t been available.
“That makes it difficult to assess who’s most vulnerable to heat, especially in rural areas where people may have fewer options to cool off,” Ahn said. “In urban areas, people might go to a library or pool, but in rural areas, people may work outside and come home to hot indoor environments.”
The KU researcher said her dataset could help public health officials and policymakers identify regions that lack adequate cooling and where people might need support programs or energy subsidies.
“It could also inform energy efficiency decisions, helping people choose the most appropriate cooling systems for their climate without unnecessary cost,” she said.
To compile and analyze more detailed information about AC use nationwide, the KU researcher used Dewey’s comprehensive real estate dataset at the household level, combined with variables she’d identified in earlier studies – such as housing type, building age, renovation year, race and ethnicity, historical housing policies and climate data.
Then, to paint a fuller picture of access to air conditioning, Ahn and co-author Christopher Uejio of Florida State University relied on machine-learning algorithms to fill gaps in the data.
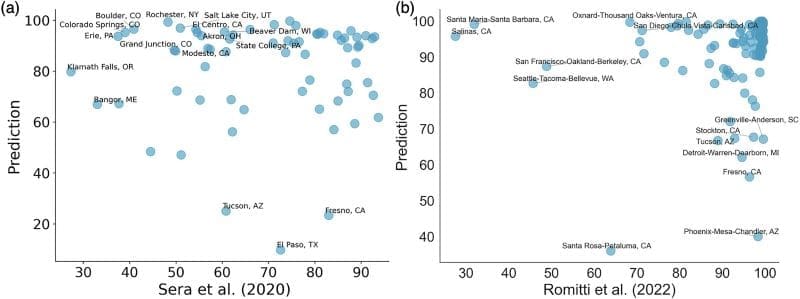
“Because the Dewey data had missing information that wasn’t random, I used a random forest algorithm to impute missing values,” she said. “Some variables, like housing type, had too much missing data and were excluded. Then I used another machine learning model, XGBoost, to classify homes into four AC types: central AC, other types like window or portable units, evaporative coolers and none. Using those predictions, I created counts of AC ownership by census tract. XGBoost worked well because it handles both categorical and continuous data, with overall accuracy between 97–99. Accuracy varied by air conditioning type, ranging from 87 % to 97 %.”

Ahn said she was surprised by some findings.
“Previous studies only focused on metropolitan areas, but my dataset allowed me to compare rural and urban regions,” Ahn said. “There were clear differences. For instance, central and evaporative coolers were more common in rural parts of Oregon, while urban areas had more central and ‘other’ types or no AC at all. Moreover, approximately 20 % of households in Florida used other types of air conditioning, while more than 95 % of homes in urban areas had central AC.”
The KU researcher also found socioeconomic and demographic differences in the more detailed data, which were impossible to glean from data with less resolution.
“Climate and heating type were the strongest predictors overall, but the proportion of Hispanic residents was an important variable for some AC types, especially evaporative coolers and other types,” Ahn said. “Those units are concentrated in regions like California and New Mexico, which also have high Hispanic populations.”
Ahn said New York City didn’t align well with the model’s predictions, likely due to its unique characteristics compared to other parts of the United States. “The housing stock there is older, and incomes are high, but AC types vary in ways the model couldn’t fully capture,” Ahn said.
She acknowledged limitations in her data, which could motivate follow-up research.
“Some regions have higher missing data rates, which adds uncertainty,” Ahn said. “Metropolitan areas like New York City had especially high missing-ness, making those predictions less reliable. Another limitation is that my dataset represents current conditions, not historical trends. I hope to develop a historical dataset from 1980 onward, the last time the Census Bureau conducted a national AC survey.”
Finally, self-reported data from surveys, such as the American Housing Survey, may not accurately reflect actual usage, Ahn said. For example, people might report on such a survey that they don’t have AC, but they actually use a swamp cooler or portable unit.
In the future, Ahn plans to combine data from multiple sources to compensate for their limitations. The researcher, who joined KU faculty in 2023, is planning follow-up research to include historical data and to work with students on future projects as her lab grows at KU.
Journal Reference:
Ahn, Y., Uejio, C.K., ‘A Comprehensive Dataset of Residential Air Conditioning Prevalence in the Continental United States’, Scientific Data 12, 1717 (2025). DOI: 10.1038/s41597-025-06104-3
Article Source:
Press Release/Material by University of Kansas (KU)
Sustainable manure management boosts soil health and slashes greenhouse gas emissions
Researchers at Hainan University, the Chinese Academy of Sciences, and their partners have revealed how different soil management strategies impact the soil microbiome and the ecological processes that control the nitrogen cycle. Their findings show that when manure is integrated with synthetic nitrogen fertilizer, both soil organic carbon and total nitrogen are significantly increased. This synergy leads to better soil fertility and improved crop performance without the environmental burden commonly associated with traditional fertilizers.
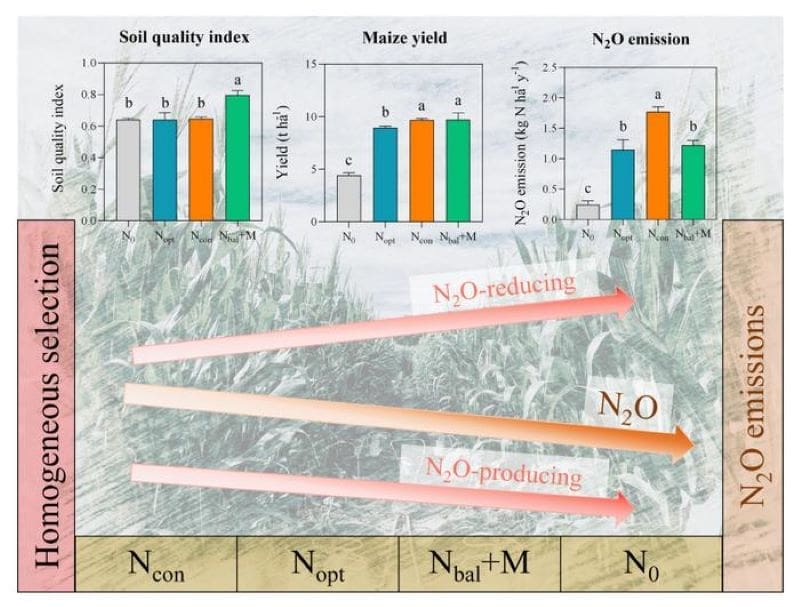
The experiment, conducted in the North China Plain, compared four fertilizer treatments: no fertilizer, conventional synthetic fertilization, an optimal synthetic fertilizer rate, and a balanced combination of manure and synthetic fertilizer. Plots treated with the manure-plus-synthetic blend registered the highest soil quality scores and maintained yields comparable to those managed with high synthetic input alone.

Crucially, the integrated manure approach produced much lower nitrous oxide emissions than conventional synthetic fertilization. Nitrous oxide, also known as N₂O, is roughly 300 times more potent than carbon dioxide as a greenhouse gas. The key to this reduction lies in the soil microbes responsible for nitrogen cycling. Manure-amended plots had a much larger population of microbes carrying the nosZ (Nitrous Oxide Reductase) gene, which enables the final step of denitrification – the conversion of N₂O to benign nitrogen gas.
By using advanced molecular approaches, such as high-throughput gene sequencing and new ecological modeling, the researchers traced how fertilizer strategies select for different groups of nitrogen-cycling microbes. Conventional fertilization was shown to favor microbes that produce more N₂O, whereas integrated manure management stimulates those that can break N₂O down.
The study also highlights the roles of both deterministic and random (stochastic) forces in shaping microbial communities under various fertilizer treatments. Notably, key microbes for nitrification and denitrification are largely steered by environmental selection, which means that fertilizer choices can predictably drive soil microbiome function toward either higher or lower emissions.
The authors point out that their results offer a practical roadmap for sustainable agriculture: farmers can maintain, or even increase, yields while helping to meet climate targets by fine-tuning fertilizer applications. The team believes that such ecological engineering of soil microbiomes may be the next frontier for reducing greenhouse gases from agriculture.
Future research should investigate how these findings apply to different agroecosystems and explore the economic and logistical factors needed for wide-scale adoption of integrated manure management.
Journal Reference:
Wang Z, Li Y, Liu X, Ju X, ‘Integrated manure application enhances soil quality and reduces nitrous oxide emissions by deterministically shaping N cycling guilds’, Nitrogen Cycling 1: e007 (2025) . DOI: 10.48130/nc-0025-0007
Article Source:
Press Release/Material by Biochar Editorial Office | Shenyang Agricultural University
Unprecedented decline in marine viruses in the western Mediterranean linked to climate change revealed
A team led by the Institut de Ciències del Mar (ICM-CSIC) has described a sustained and unprecedented decrease in the abundance of marine viruses in the northwestern Mediterranean over the last two decades. The finding, published in the journal ISME Communications, is based on the longest-known time series data on marine viruses to date, from the Blanes Bay Microbial Observatory (BBMO) in Girona.
The results show that since 2011, the abundance of viruses in seawater has continuously decreased, coinciding with a progressive increase in water temperature and transparency, along with a significant reduction in nutrients and phytoplankton biomass. These changes reflect an oligotrophication process – meaning an impoverishment in nutrients – which transforms the marine ecosystem into a more pristine and less altered environment.
“What we observe is a clear signal that global change, and especially climate change, is reconfiguring even the most minute microbial communities – those invisible to the human eye but essential for the functioning of the oceans,” explains Xabier López-Alforja, lead author of the study. “Marine viruses fulfill critical roles in ecosystems: they regulate microbial populations, recycle nutrients, and can favor the transport of carbon to the ocean floor, a key process in global climate regulation.”

A unique observatory
The work relies on the data series generated by the Blanes Bay Microbial Observatory, where monthly surface water samples have been collected since 2001. This continuous effort spanning over two decades makes the BBMO a unique observatory worldwide for studying long-term microbial dynamics.
The research utilized advanced statistical tools, such as Generalized Additive Mixed Models (GAMMs), which allowed the team to model and understand the marked seasonal variability of both microorganisms and different environmental variables in this part of the Mediterranean. Additionally, the scientific team applied artificial intelligence techniques – specifically, neural network models – to unravel the complex interactions between viruses and their environment.
“Thanks to the combination of advanced statistics and machine learning, we’ve been able to see beyond immediate variability and recognize hidden patterns that indicate how viruses respond to warming and nutrient loss,” details López-Alforja.
Ecological and social implications
The decline in the abundance of marine viruses could have significant consequences for ecosystems and for society. By altering the control of microbial populations and the efficiency of nutrient recycling, these changes can accelerate the decrease in marine productivity and affect the stability of the food web.
“If viruses decrease, the way nutrients circulate in the ocean is also modified,” adds Dolors Vaqué, an ICM researcher. “That can affect not only the balance of coastal ecosystems but also human activities like fishing, upon which entire societies in the Mediterranean depend.”
Until now, most studies on marine viruses were conducted along spatial gradients or in very short time series, usually less than two years. The lack of long-term data made it difficult to clearly evaluate the effects of global change on these organisms.
“Our research raises questions about how this effect on viral communities translates to those of other microorganisms and to biogeochemical cycles,” comments Felipe Coutinho. “Only with long time series can we distinguish natural fluctuations from trends induced by climate change. And in this case, the signal is unequivocal: viruses are decreasing in parallel with the oligotrophication of the Mediterranean.”
Towards new research avenues
The study is the result of a collective effort among various ICM-CSIC researchers who keep the Blanes Bay Observatory operational. The research team is now working on sequencing and analyzing the genetic material of the viruses collected over these years to determine if the loss of abundance is also reflected in changes in the genetic diversity of viral communities.
They also assert that the consistency with analyses from other studies based on shorter time series in the region confirms a generalized trend across the entire Mediterranean basin.
Journal Reference:
Xabier Lopez-Alforja, Elisabet L Sà, Maria V Quiroga, Massimo C Pernice, Clara Cardelús, Vanessa Balagué, Josep M Gasol, Felipe H Coutinho, Ramon Massana, Dolors Vaqué, ‘Long-term decline of marine viruses associated with warming and oligotrophication at a NW Mediterranean coastal site’, ISME Communications 5, 1: ycaf150 (2025). DOI: 10.1093/ismeco/ycaf150
Article Source:
Press Release/Material by Spanish National Research Council (CSIC)
How emission control policies deliver synergetic climate and environmental health benefits in transportation sector
Air pollution and climate change have long been managed through separate policy tracks, even though both originate from the same fossil fuel-based energy system that warms the planet and pollutes the air. In recent years, China has made “GHG-emission and air-pollution co-control” a central strategy for high-quality development, shifting national governance from single-objective control to integrated management of air pollutants and greenhouse gases.
Clean air actions and carbon mitigation policies have achieved remarkable progress, yet single policies rarely deliver both goals. Policymakers are now turning to combinations of multiple policies to pursue stronger multiple benefits, but there has been less unified framework that consistently quantifies both health and climate dimensions to capture the full spectrum of synergies and trade-offs in designing GHG and air pollution co-control policy.

To address this challenge, the team developed a policy-specific synergetic level analysis framework that integrates a detailed bottom-up emission inventory, a chemical transport model, an epidemiological concentration-response model, and a customized Synergy Index within a unified system.
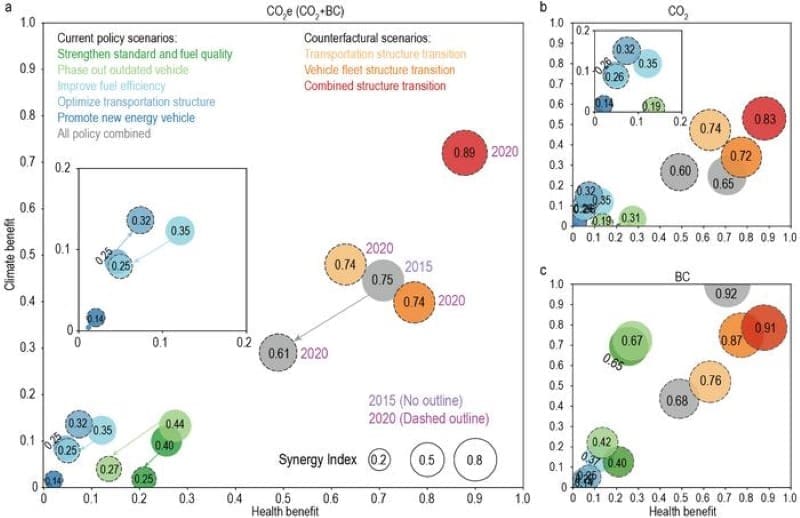
Applying this framework to China’s on-road transportation sector, the researchers found that China’s on-road environmental policies reduced GHG emissions (i.e., covering CO₂ and black carbon) by 427 Mt CO₂e and averted 104,000 premature mortality during 2010-2015, but these gains declined to 278 Mt CO₂e and 72,000 premature mortality in 2015-2020, making the Synergy Index declined from 0.75 to 0.61 during the two periods.
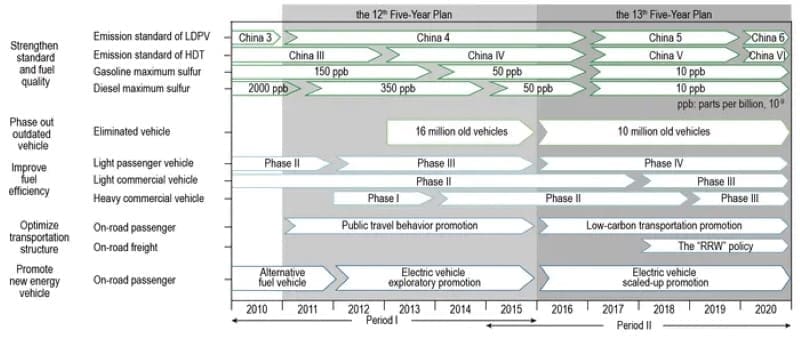
Policy-specific evaluations reveal that traditional policies like tightening emission standards and fuel quality and removing high-emitting vehicles drove early synergies.
Conversely, emerging structural transitions, including promoting electric vehicles and modal shift from road to more efficient modes, grew in prominence but failed to offset declining efficacy. Strategic optimization of vehicle fleet and transportation structure to meet 2025 targets could reverse this decline trend. These findings underscore the urgency of accelerating structural transitions to sustain effective carbon and pollution co-control in transportation sector, with global relevance for fossil fuel-dependent economies.
The framework further revealed that reductions in short-lived climate pollutants such as black carbon would have delivered strong near-term air-quality and climate benefits, helping reinforce the momentum toward long-term decarbonization.

“It’s like seeing the hidden mechanics of policy synergies for the first time,” explained lead author, CAEP’s Zhulin Qi.
“Our framework acts as a diagnostic tool, revealing which actions truly work together and where new opportunities lie,” Yixuan Zheng said. “By assessing different policies and their combinations within one system, we can observe the overall effectiveness of different policy combinations and the specific focus of individual policies, making it possible to identify those that achieve true synergies.”
The policy-specific framework and Synergy Index offer policymakers a science-based tool to advance carbon and air pollution co-control and contributes a valuable “China experience” to the world’s pursuit of sustainable development.
Journal Reference:
Zhulin Qi, Yixuan Zheng, Wenxin Cao, Yuxi Liu, Xin Li, Yueying Fei, Shigan Liu, Fangming Jiang, Chuchu Chen, Yueyi Feng, Zhang Wen, Xuying Wang, Yu Lei, Zhibin Wang, Gang Yan, Jinnan Wang, ‘Weakening synergies in carbon and air pollution co-control necessitate robust structural transitions in China’s transportation sector’, National Science Review nwaf422 (2025). DOI: 10.1093/nsr/nwaf422
Article Source:
Press Release/Material by Science China Press
Featured image credit: Gerd Altmann | Pixabay


