Explore the latest insights from top science journals in the Muser Press daily roundup (May 25, 2025), featuring impactful research on climate change challenges.
In brief:
When the sea moves inland: A global climate wake-up call from Bangladesh’s Delta
As sea levels climb and weather grows more extreme, coastal regions everywhere are facing a creeping threat: salt.
Salinization of freshwater and soils adversely affects 500 million people around the world, especially in low-lying river deltas.
A new study led by researchers at the University of Portsmouth, in partnership with Dhaka University and Curtin University, sheds light on how rising oceans are pushing saltwater into freshwater rivers and underground water sources in the world’s largest river mouth – the Bengal Delta in Bangladesh.
Drawing on nearly two decades of data from over 50 monitoring stations in coastal Bangladesh, the team tracked a consistent rise in salt levels in rivers and estuaries, particularly since the mid-2000s.
The western parts of the delta, already more prone to tidal influence, showed the fastest increases in salinity. The data suggests that the combination of sea-level rise, reduced freshwater flow, and increasingly frequent storm surges are all contributing to the inland movement and retention of saltwater.
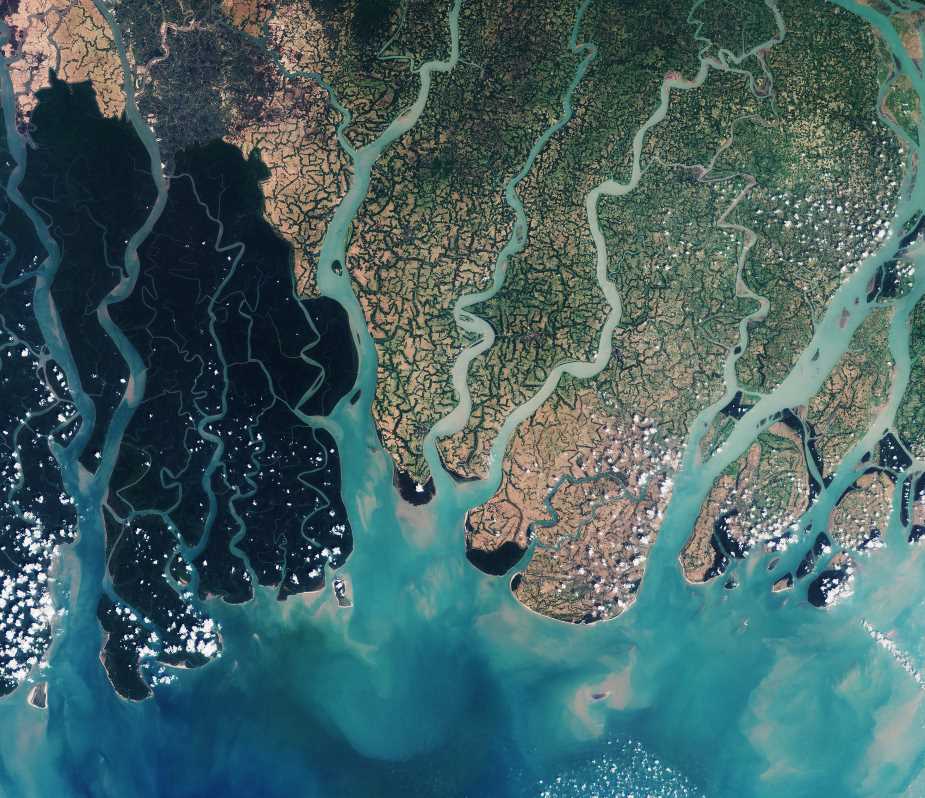
Since around 2007, many parts of the delta have experienced stepwise increases in salinity, often linked to powerful storms like Cyclone Sidr. These changes can devastate crops, erode food security, and force communities to move. While the analysis focused primarily on environmental data, it underscores how salinity intrusion is increasingly a threat to livelihoods, public health, and regional stability.
The study, published in Ecological Indicators, uses one of the most detailed and long-running salinity datasets in any delta system worldwide. It applied advanced statistical methods to distinguish long-term trends from short-term weather or seasonal changes.
The researchers introduced a new conceptual model called the Offshore Controlled Estuarine and Aquifer Nexus (OCEAN) framework, that highlights how offshore features like steep underwater slopes and restricted tidal flows can trap salt in low-lying coastal zones.
Dr Mohammad Hoque from the University of Portsmouth’s School of the Environment and Life Sciences: said: “What we’re seeing in the Bengal Delta is not just a local crisis, it’s a signal of what’s coming for low-lying coastal areas around the world.
“Salinity is rising faster and reaching farther inland than many people realise, and it’s happening quietly with major consequences for water security, agriculture, and livelihoods. This study helps us understand the mechanics behind it, and underscores the urgency for coordinated, global action.”
The findings also show the limits of relying only on land-based solutions. Human interventions like embankments, riverbed alterations, and upstream dams have often made things worse by restricting freshwater flows.
Meanwhile, offshore dynamics – such as sediment build-up and ocean current shifts – play a larger role than previously appreciated. Addressing the problem, therefore, requires integrated approaches that connect rivers, oceans, and climate systems.
Coastal regions in California, including Los Angeles County and the Sacramento-San Joaquin Delta, are combating saltwater intrusion through innovative measures. In LA, freshwater is injected into aquifers to create hydraulic barriers against seawater. However, population growth and groundwater extraction continue to challenge these efforts.
“While the focus is on Bangladesh, the study’s implications are global”, said Dr Sean Feist, former PhD researcher at the University of Portsmouth and now Scientific Officer at Test Valley Borough Council. “Coastal regions from the Mekong Delta in Vietnam to Louisiana’s wetlands in the United States face similar pressures. As sea levels continue to rise, the risk of agricultural land turning salty, drinking water becoming undrinkable, and shallow groundwater becoming permanently brackish grows ever more serious.”
The paper recommends that similar long-term investigations into changing salinity levels be conducted in other vulnerable coastal regions around the world, particularly in low-lying deltas facing rising seas, reduced river flows, and increasing storm activity. Short-term datasets can often misrepresent the scale or pace of salinisation, while extended records offer a clearer picture of how saltwater intrusion evolves over time.
Dr Ashraf Dewan from Curtin University said: “Ultimately, this study highlights that the creeping salinisation of deltas is a slow-moving but deeply disruptive force. Without urgent investment in salt-tolerant agriculture, better water storage, and strategic planning across entire river basins, the disruptive impacts of salinity are likely to intensify. The Bengal Delta is on the frontline of climate change, but it is not alone. The patterns observed here are emerging in many of the world’s great coastal regions. What happens next depends on how quickly we respond.”
Journal Reference:
Sean E. Feist, Mohammad A. Hoque, Md. Atikul Islam, Ashraf Dewan, Mike Fowler, ‘Sea-level rise drives changes in salinisation patterns in low-lying Bangladesh’, Ecological Indicators 176, 113543 (2025). DOI: 10.1016/j.ecolind.2025.113543
Article Source:
Press Release/Material by University of Portsmouth
Satellites offer new view of Chesapeake Bay’s marine heatwaves
Heatwaves destroy crops, drive wildfires, and kill humans and wildlife, but these extreme weather events aren’t just limited to land. Large bodies of water can also be hit by heatwaves that linger for weeks, months and sometimes years — much like “The Blob,” a sprawling hot spot off the U.S. West Coast that wreaked havoc on Pacific Ocean ecosystems from 2013 to 2016.
New University of Maryland-led research reveals that the Chesapeake Bay has seen “significant increases” in annual marine heatwaves, defined in the study as “prolonged periods of anomalously warm water.” Published in the journal Estuaries and Coasts, the study leveraged long-term satellite observations to map out heatwaves over 20 years.
The data revealed that, on average, the Chesapeake Bay experiences heatwaves 25 days annually. From 2003 to 2022, the bay had a roughly 10% uptick in annual marine heatwaves, translating to two to four additional marine heatwaves per decade.
“It sounds small, but a little bit goes a long way in the climate system,” said study lead author Rachel Wegener (M.S. ’23, atmospheric and oceanic science), who conducted this research as part of her master’s thesis at UMD.
Wegener explained that each additional heat wave can have an outsized effect on the Chesapeake, one of the largest and most biologically productive estuaries in the United States. Some marine species are sensitive to high temperatures, which can affect their reproduction and distribution.
“One additional marine heat wave at the wrong time in the spring might throw off recruitment of new fish to a population, affecting species numbers for the rest of the year,” Wegener said. “Striped bass, a common recreational and commercial fishing species, typically spawn in the Chesapeake Bay and its tributaries. Spawning goes down if the water temperatures are too high.”
Wegener took the lead on this research following the graduation of co-author Skylar Lama (B.S. ’22, atmospheric and oceanic science), who initiated the study for her undergraduate capstone project at UMD. Additional study co-authors include Jacob Wenegrat, an assistant professor in UMD’s Department of Atmospheric and Oceanic Science, and Veronica Lance, a National Oceanic and Atmospheric Administration (NOAA) oceanographer.
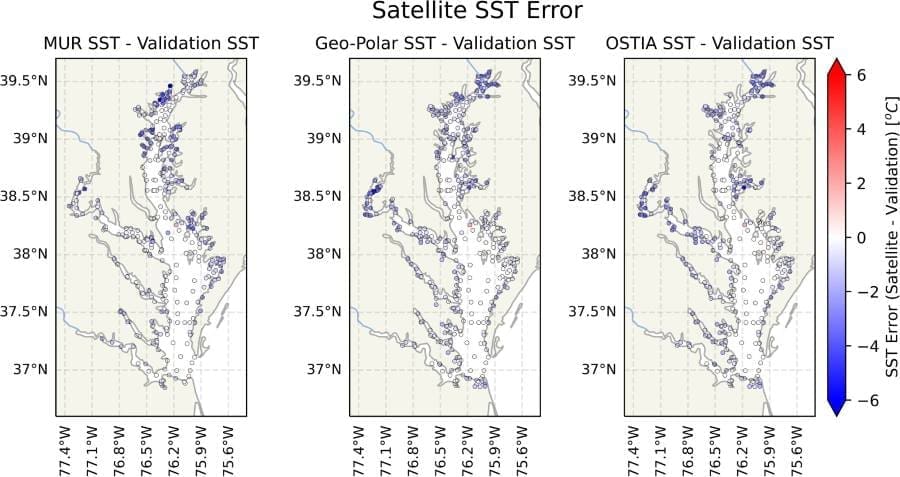
While analyzing three satellite datasets from NASA, NOAA and the European Union Space Programme, the research team made a novel discovery: The duration and frequency of Chesapeake heatwaves vary greatly from the top of the bay to the bottom. The lower portion — an area covering 1,500 square miles south of the Potomac River — experiences fewer individual heatwaves, but these events tend to last longer. The upper bay, on the other hand, has more frequent but shorter heatwaves.
“These two regions of the bay look like they have the same number of heat wave days per year, but the different underlying patterns might have different implications — not just for the mechanisms driving them, but also their effect on the ecosystem,” Wenegrat said.
While researchers identified significant differences between marine heatwaves in different parts of the bay, the reason for this variation remains a mystery.
“The Chesapeake is quite large, and processes from the ocean, rivers and atmosphere can have different effects in different locations,” Wegener said. “Diving into the ‘why’ behind these results and understanding what processes cause the spatial variability would be an exciting avenue for further research.”
When the researchers first started exploring this issue, they wanted to determine whether satellite data could offer a more complete picture of where heatwaves occur. Previous studies relied on data collected by buoys and boats, which revealed heat wave trends over time but did not show how much they varied from one location to the next.
Earlier research may have been limited by the difficulty of collecting on-site data from the bay’s harder-to-reach tributaries, according to Wenegrat.
“One of the major outcomes of this study is that it serves as a proof of concept that you can use satellite data in this way,” Wenegrat said. “It pushes the boundary of satellite resolution for sea surface temperature into these relatively thin estuary settings and suggests it’s possible to study and monitor other locations that are not as well-observed.”
Understanding how and where these heatwaves occur — and the unique threats they pose — can help those who manage the bay and its many resources. In a 2023 report, the Chesapeake Bay Program’s Scientific and Technical Advisory Committee identified a need for a marine heat wave warning system. Wegener explained that satellite data is a “prime candidate” for forming the basis of this system.
“It’s a view from the sky of water temperatures in the Chesapeake Bay — a difficult view to produce by any other means,” Wegener said. “Plus, it’s free to the public from NOAA through the Coastwatch Program.”
Beyond shedding light on marine heatwaves, Wegener said their study is another example of how publicly funded satellite data can benefit society.
“There is a huge amount of social and economic benefit in this data that goes far beyond the temperature of water,” Wegener said. “Publicly funded, openly available data touches our hobbies, our safety and our livelihoods. It’s not always immediately visible, but we are benefitting from NOAA and NASA satellite data every day.”
***
This research was supported by NOAA (Grant No. NA19NES4320002) and the U.S. National Science Foundation (Award No. 2126474). This article does not necessarily reflect the views of these organizations.
Journal Reference:
Wegener, R., Wenegrat, J., Lance, V.P. and Lama, S., ‘Spatial Variability of Marine Heatwaves in the Chesapeake Bay’, Estuaries and Coasts 48, 113 (2025). DOI: 10.1007/s12237-025-01546-9
Article Source:
Press Release/Material by University of Maryland
Even weak tropical cyclones raise infant mortality in poorer countries, USC-led research finds
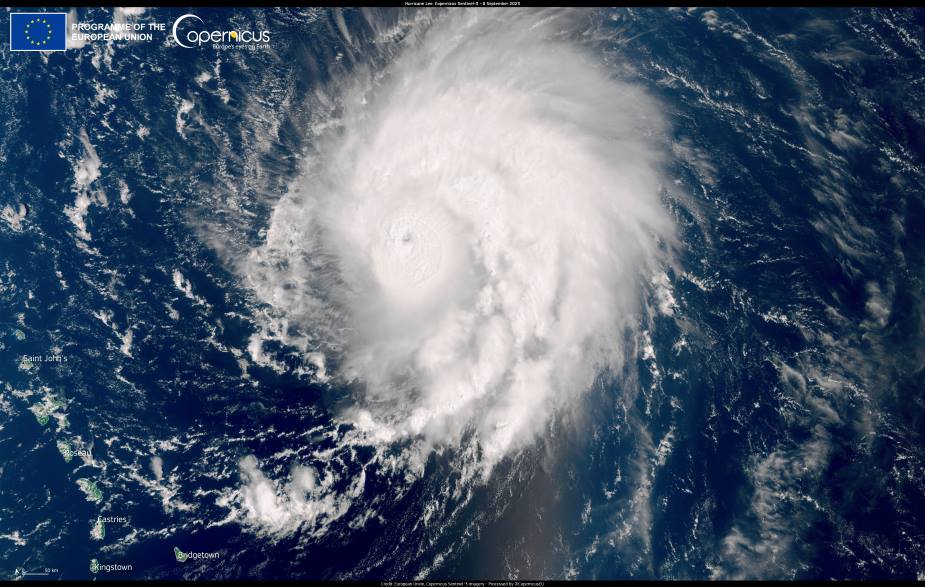
Tropical cyclones, including storms below hurricane and typhoon strength, were associated with a sharp rise in infant mortality in low- and middle-income countries during the first two decades of this century, according to new research published in Science Advances. The findings point to a critical need for stronger disaster response and child health protections in vulnerable regions, especially as climate change increases the frequency and severity of these storms.
Infants in these regions exposed to tropical cyclones before they were born or during their first year of life were significantly more likely to die: Infant mortality rose an average of 11% over baseline rates — an increase of 4.4 deaths per 1,000 live births.
The risk was greatest in the first year after a storm and did not appear to persist beyond two years after.
Surprisingly, the increase in mortality could not be explained by reduced access to prenatal care or worsening nutrition, two commonly cited health risks following natural disasters. “The fact that health care use and undernutrition were not affected by tropical cyclone exposure suggests that the mortality effects are driven by other factors that we could not directly study,” said lead author Zachary Wagner, associate professor (research) of economics at the USC Dornsife College of Letters, Arts and Sciences and senior economist at the College’s Center for Economic and Social Research. “We have a lot more research to do to uncover these main drivers.”
The study team — which included researchers from RAND Corporation, Stanford University, Johns Hopkins University and Belgium’s UCLouvain — found that the increased mortality followed not just the most intense storms but also lower-intensity tropical storms, which are far more common.
“Some of the countries had only a few Category 3 or higher storms during the period we studied,” said Zetianyu Wang, a PhD student under Wagner at RAND and first author on the report. This made it more difficult to detect clear links between the most intense storms and infant deaths. “But that doesn’t mean the impact of larger storms is absent. As the planet warms, we risk more tragedies across the globe if measures aren’t taken to protect children in the poorest countries.”
Storm effects varied widely among countries
The researchers analyzed nearly 1.7 million child records from seven economically disadvantaged countries: Madagascar, India, Bangladesh, Cambodia, the Philippines, the Dominican Republic and Haiti.
While the average increase in infant mortality across all of these countries was 11%, the impact of storms varied significantly from country to country. In Bangladesh, Haiti and the Dominican Republic, cyclones were followed by increases of more than 10 deaths per 1,000 births. In contrast, little to no increase in mortality was observed in India, the Philippines, Cambodia and Madagascar. The researchers say it remains unclear why some countries fare better than others. The differences may reflect varying levels of disaster preparedness, geographic vulnerability, or underlying public health conditions.
“Some countries may be helped by mountains while others have more flood-prone areas,” Wagner said. “Some countries have better systems in place for evacuation efforts, or they may have sturdier housing while others rely on thatched roofs. And in some places, children may already be malnourished or in poor health from malaria and other diseases, which increases vulnerability.”
Understanding the reasons behind the differences, Wagner says, will be a key focus of future research.
“If we want to protect children from the growing threat of climate-linked disasters,” he said, “we need to understand not just where risk is greatest, but why.”
***
In addition to Wagner and Wang, authors on the study include Renzhi Jing, Sam Heft-Neal and Eran Bendavid of Stanford University; Aaron Clark-Ginsberg of RAND; and Debarati Guha-Sapir of UC Louvain and Johns Hopkins University.
Journal Reference:
Zetianyu Wang et al., ‘The impact of tropical cyclone exposure on infant mortality in low- and middle-income countries’, Science Advances 11, 21, eadt9640 (2025). DOI: 10.1126/sciadv.adt9640
Article Source:
Press Release/Material by Darrin S. Joy | University of Southern California
Turf algae chemically inhibit kelp forest recovery in warming coastal waters
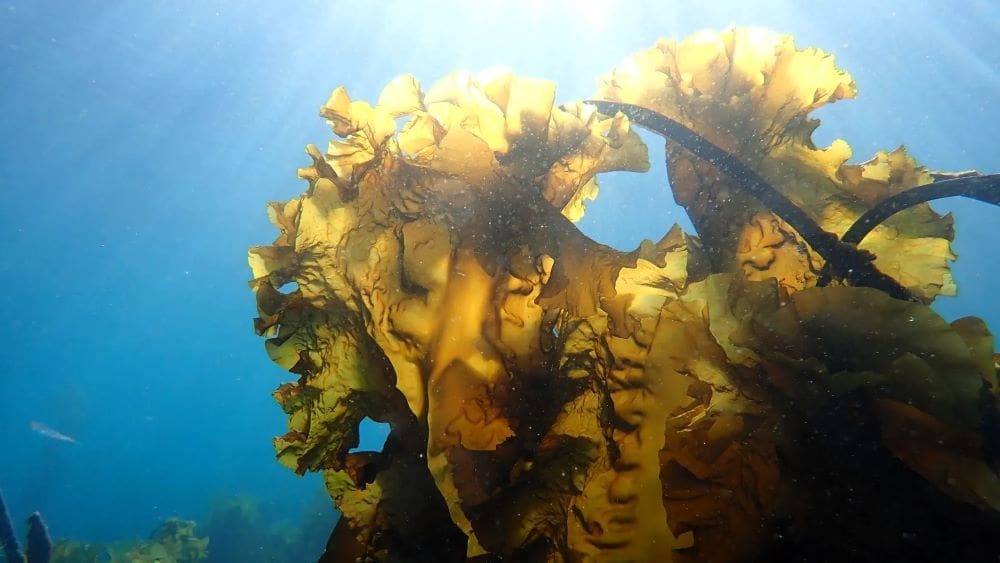
As kelp forests decline in the warming coastal waters of the Gulf of Maine, turf algae – dense mats of red algae replacing kelp in many regions – may chemically interfere with kelp recovery, a new study reports. This complicates efforts to restore these crucial marine ecosystems.
Kelp forests are ecologically and economically vital marine ecosystems that support diverse life forms and functions. However, despite their widely recognized importance, kelp forests worldwide are threatened with collapse due to climate change and/or overfishing. In many regions where kelp forests have disappeared, they have been replaced by dense, low-lying mats of chemically rich, filamentous red seaweeds, also known as turf algae. This shift has been linked to declines in biodiversity and major disruptions in coastal ecosystem dynamics.
Some research suggests that turf algae may actively hinder the recovery of kelp through allopathy – a common biological phenomenon by which one organism produces biochemicals that influence the growth, survival, development, and reproduction of other surrounding organisms. Understanding whether turf algae chemically inhibit kelp recovery is essential to managing and restoring these rapidly changing marine environments.
Shane Farrell and colleagues investigated whether allopathic turf algae suppress the recovery of kelp forests in the warming waters of the Gulf of Maine. Farrell et al. discovered that while kelp forests have persisted in the cooler waters of northeastern Maine, those in the warmer southwest have collapsed and failed to recover, with turf algae now dominating these reefs.
By comparing the chemical composition of water and seaweed samples from kelp- and turf-dominated reefs, the authors identified distinct chemical signatures produced by turf algae. Laboratory experiments show that these turf-derived compounds inhibit the early growth stages of kelp. The findings suggest that turf algae alter the chemical ecology of the environment in ways that actively prevent kelp from re-establishing.
“Future resilience strategies for marine ecosystems should integrate chemical ecology into climate change models,” write Colette Feehan and Karen Filbee-Dexter in a related Perspective. “By illuminating these hidden processes, we can better develop a fuller picture of how climate change is reshaping ocean ecosystems – and how we might better protect them.”
Journal Reference:
Shane P. Farrell et al., ‘Turf algae redefine the chemical landscape of temperate reefs, limiting kelp forest recovery’, Science 388, 6749, 876-880 (2025). DOI: 10.1126/science.adt6788
Article Source:
Press Release/Material by Walter Beckwith | American Association for the Advancement of Science (AAAS)
Featured image credit: Gerd Altmann | Pixabay


