Explore the latest insights from top science journals in the Muser Press daily roundup (September 10, 2025), featuring impactful research on climate change challenges.
In brief:
Models show benefits of climate-smart agriculture practices
A study using multiple agronomic models to examine two long-term agricultural research stations in North America shows that so-called climate-smart agricultural practices – like no-till treatments, cover-crop utilization and residue retention – can help promote carbon sequestration in soil and reduce greenhouse gas emissions.
The findings show that using a combination of models – rather than just one – can provide a more realistic range of outcomes and can highlight the shortcomings of individual models.
“We targeted open-source data from long-term agricultural experiments in Michigan and Texas that are very different – with different climates, soils and crops grown,” said Debjani Sihi, the senior author of a paper describing the research. “By utilizing these long-term studies, we wanted to see what the future might look like in terms of carbon sequestration and greenhouse gas emissions.
“We examined three different models developed by different research groups and looked at them collectively,” said Sihi, an assistant professor with joint appointments in NC State’s Department of Plant and Microbial Biology and Department of Crop and Soil Sciences. “The architecture is a little different in these models. What can we learn from each of the models, and what is the collective information?”

The study examined data from more than three decades at the two agricultural experimental sites and calibrated it into a “model ensemble” to make future predictions. The ensemble examined both individual climate-smart agricultural practices and practices that were “stacked,” or added to each other.
The researchers then examined whether these proposed practices would, in the next 25 years or so, generate carbon sequestration in soil and a reduction of greenhouse gas emissions in two different scenarios: a baseline scenario that replicated climate change historical data of the past three decades, and a “worst-case” scenario that envisions dramatic growth in greenhouse gas emissions.
“We tried to capture a variety of biological processes related to soil carbon sequestration and greenhouse gas (methane and nitrous oxide) emission while also accounting for climate change effects,” Sihi said. “These processes are driven by different climate variables like temperature and precipitation.”
The model ensemble showed some positive effects in both studied locations under the baseline scenario.
“At the Michigan site, we found that no-till farming and keeping crop residues on the field increased soil carbon sequestration, while using no-till farming, some cover crops, and reducing fertilizer decreased greenhouse gas emissions,” Sihi said. “At the Texas site, most of the farming practices we tried increased soil carbon sequestration, and greenhouse gas emissions stayed about the same. However, the models indicated that not plowing alone could reverse greenhouse gas emissions.”
The worst-case scenario, however, lived up to its name in the study.
“We also found that all the climate-smart farming practices performed worse under worst-case scenario climate change, which was expected,” Sihi said.
She added that the study could provide the impetus for other researchers to try out the model ensemble approach and improve it. Future studies could be improved by using real-world data from on-farm studies and selecting other models with different strengths to broaden the insights.
“We hope others will evaluate these climate-smart practices to learn which may be more important, and what kind of experiments that we can leverage,” Sihi said. “These are two long-term examples in Michigan and Texas that we have utilized, so that others could adopt and improve and build on it.
“In this context, utilizing no-till or cover crops as a base practice and then stacking residue retention reduced future net emissions. Future work would need more study in other parts of the country – or world – to better generalize effects.”
The paper appears in Agronomy Journal. Ellen Maas, a former postdoctoral researcher who worked with Sihi on this project, is the paper’s first author.
***
Support for the work was primarily provided by Valent BioSciences, a subsidiary of Sumitomo Chemical Co., Ltd; with partial support from the U.S. Department of Agriculture’s National Institute of Food and Agriculture Project numbers 7009808 and 7010251. The study also drew on data supported by the National Science Foundation’s Long-term Ecological Research Program, Grant/Award Number DEB 2224712.
Journal Reference:
Maas, E. D. v. L., & Sihi, D., ‘Management alternatives for climate-smart agriculture at two long-term agricultural research sites in the United States: A model ensemble case study’, Agronomy Journal 117, 5: e70146 (2025). DOI: 10.1002/agj2.70146
Article Source:
Press Release/Material by Mick Kulikowski | North Carolina State University (NCSU)
Ocean warming puts vital marine microbe at risk
Among the tiniest living things in the ocean are a group of single celled microbes called Prochlorococcus. They are cyanobacteria, also known as blue-green algae, and they supply nutrients for animals all the way up the food chain. Over 75% of surface waters teem with Prochlorococcus, but as ocean temperatures rise, researchers fear that the water might be getting too warm to support the population.
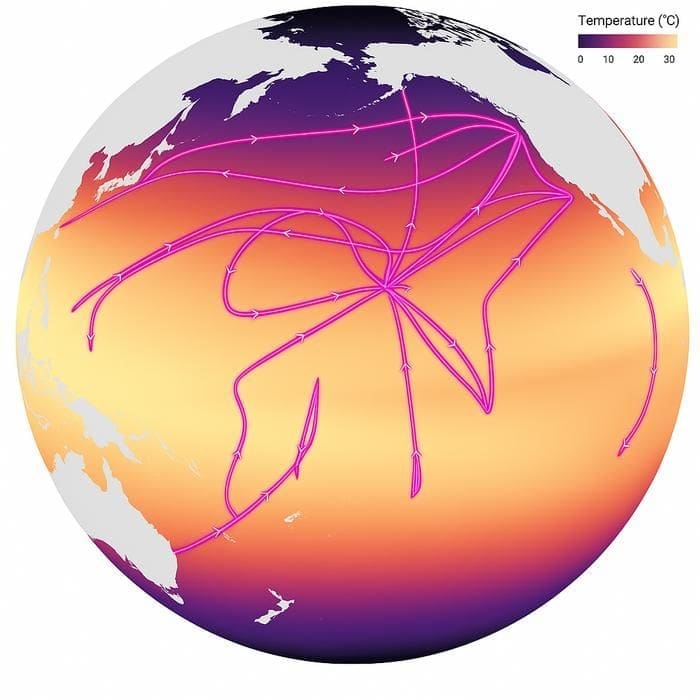
Prochlorococcus is the most abundant photosynthesizing organism in the ocean, accounting for 5% of global photosynthesis. Because Prochlorococcus thrive in the tropics, researchers predicted that they would adapt well to global warming. Instead, a new study finds that Prochlorococcus prefers water between 66 and 86 degrees and doesn’t tolerate water much warmer. Climate models predict that subtropical and tropical ocean temperatures will exceed that threshold in the next 75 years.
“For a long time, scientists thought Prochlorococcus was going to do great in the future, but in the warmest regions, they aren’t doing that well, which means that there is going to be less carbon – less food – for the rest of the marine food web,” said François Ribalet, a University of Washington research associate professor of oceanography, who led the study.
Their results were published in Nature Microbiology.
In the past 10 years, Ribalet and colleagues have embarked on close to 100 research cruises to study Prochlorococcus. His team has analyzed approximately 800 billion Prochlorococcus-sized cells across 150,000 miles around the world to figure out how they are doing and whether they can adapt.
“I had really basic questions,” Ribalet said. “Are they happy when it’s warm? Or are they not happy when it’s warm?” Most of the data comes from cells grown in culture, in a lab setting, but Ribalet wanted to observe them in their natural ocean environment. Using a continuous flow cytometer – called SeaFlow – they fired a laser through the water to measure cell type and size. They then built a statistical model to monitor cell growth in real time, without disturbing the microbes.
Results showed that the rate of cell division varies with latitude, possibly due to the amount of nutrients available, sunlight or temperature. The researchers ruled out nutrient levels and sunlight before zeroing in on temperature. Prochlorococcus multiply most efficiently in water that is between 66 (19°C) and 84 degrees (29°C), but above 86 (30°C), rates of cell division plummeted, falling to just one-third of the rate observed at 66 degrees (19°C). Cell abundance followed the same trend.
In the ocean, mixing transports most nutrients to the surface from the deep. This occurs more slowly in warm water, and surface waters in the warmest regions of the ocean are nutrient-scarce. Cyanobacteria are one of the few microbes that have adapted to live in these conditions.
“Offshore in the tropics, the water is this bright beautiful blue because there’s very little in it, aside from Prochlorococcus,” Ribalet said. The microbes can survive in these areas because they require very little food, being so small. Their activity supports most of the marine food chain, from small aquatic herbivores to whales.
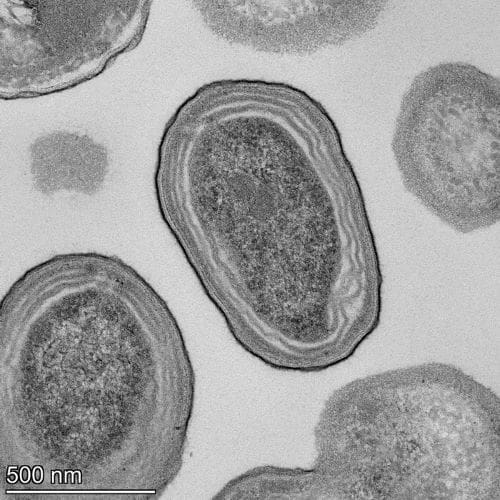
Over millions of years, Prochlorococcus has perfected the ability to do more with less, shedding genes it didn’t need and keeping only what was essential for life in nutrient-poor tropical waters. This strategy paid off spectacularly, but now, with oceans warming faster than ever before, Prochlorococcus is constrained by its genome. It can’t retrieve stress response genes discarded long ago.
“Their burnout temperature is much lower than we thought it was,” Ribalet said. The previous models assumed that the cells would continue dividing at a rate that they can’t sustain because they lack the cellular machinery to cope with heat stress.
Prochlorococcus is one of two cyanobacteria that dominate tropical and subtropical waters. The other, Synechococcus, is larger, with a less streamlined genome. The researchers found that although Synechococcus can tolerate warmer water, it needs more nutrients to survive. Should Prochlorococcus numbers dwindle, Synechococcus could help fill the gap, but it isn’t clear what the impact of this would be on the food chain.
“If Synechococcus takes over, it’s not a given that other organisms will be able to interact with it the same way they have interacted with Prochlorococcus for millions of years,” Ribalet said.
Climate projections estimate ocean temperatures based on greenhouse gas emission trends. In this study, the researchers tested how Prochlorococcus might fare in moderate- and high-warming scenarios. In the tropics, modest warming could reduce Prochlorococcus productivity by 17%, but more advanced warming would decimate it by 51%. Globally, the moderate scenario produced a 10% decline while warmer forecasts reduced Prochlorococcus by 37%.
“Their geographic range is going to expand toward the poles, to the north and south,” Ribalet said. “They are not going to disappear, but their habitat will shift.” That shift, he added, could have dramatic implications for subtropical and tropical ecosystems.
Still, the researchers acknowledge the limitations of their study. They couldn’t study every cell or sample every body of water. Their measurements are based on pooled samples, which could mask the presence of a heat-tolerant strain.
“This is the simplest explanation for the data that we have now,” Ribalet said. “If new evidence of heat tolerant strains emerges, we’d welcome that discovery. It would offer hope for these critical organisms.”
Co-authors include E. Virginia Armbrust, a UW professor of oceanography; Stephanie Dutkiewicz, a senior research scientist in the Center for Sustainability Science and Strategy at MIT; and Erwan Monier, co-director of the Climate Adaptation Research Center and an associate professor in the Department of Land, Air and Water Resources at UC Davis.
***
This research was funded by the Simons Foundation and other government, foundation and industry funders of the MIT Center for Sustainability Science and Strategy.
Journal Reference:
Ribalet, F., Dutkiewicz, S., Monier, E. et al., ‘Future ocean warming may cause large reductions in Prochlorococcus biomass and productivity’, Nature Microbiology (2025). DOI: 10.1038/s41564-025-02106-4
Article Source:
Press Release/Material by Gillian Dohrn | University of Washington
AI and climate change: How to reliably record greenhouse gas emissions
Large companies in the EU are legally required to report their greenhouse gas (GHG) emissions. Yet pulling this information manually from long PDF sustainability reports is slow and error-prone. Many teams try to speed up the process with automation – for example by using Large Language Models (LLMs), AI systems that read text and produce answers.
Project coordinator and postdoctoral researcher at the Social Data Science and AI Lab (SODA Lab), Dr. Malte Schierholz urges caution though: “With automatic extraction methods, it’s easy to fully trust the LLM’s output and overlook measurement errors that occur frequently.” Because the trend of increased automation is promising but risky at the same time, the research group Greenhouse Gas Insights and Sustainability Tracking (GIST) set out to build a reliable point of reference for collecting emission data.
A gold standard for recording emissions data
In a paper published in Scientific Data, the group introduces a gold-standard benchmark dataset for extracting GHG emissions. The dataset is based on sustainability reports sampled from companies in the MSCI World Small Cap index and the German DAX. “The basic task was to extract GHG emissions values from PDF files into a table,” says Schierholz. “What first sounded straightforward turned out to be surprisingly complex.”
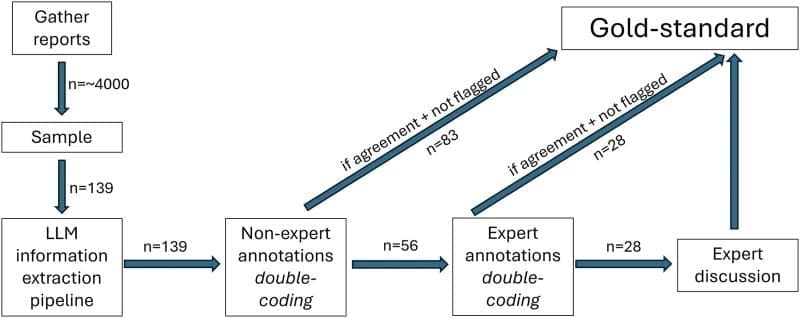
In a multi-stage process, sustainable finance experts from LMU and Deutsche Bundesbank worked with methodologists to define strict annotation rules, ran multiple rounds of extraction and verification, and convened expert discussion groups. “If you want a dataset that’s both accurate and allows for comparisons between companies, you need clear rules and plenty of feedback loops throughout the data annotation process,” says Jacob Beck, who led the annotation effort. “In the end, some ambiguous cases still required expert group discussion.”
Many companies do not provide sufficient documentation
Sustainable Finance researcher Dr. Andreas Dimmelmeier (GreenDIA consortium) was not surprised: “The hard-to-resolve cases stem not only from complex and partly inconsistent reporting protocols, but also from missing context and incomplete disclosures in company reports. Many companies in our sample did not disclose emissions according to established reporting and calculation frameworks.”
The team also observed that about half of the reports contained no usable greenhouse gas data at all. When emissions were reported, they most often referred to direct emissions and indirect emissions from energy consumption. Data on other indirect emissions, such as those arising in the supply chain or from travel and transport, was rarely complete.
The dataset – together with scripts and supplementary materials – offers a transparent, rigorously curated foundation for evaluating automated approaches to sustainability reporting. By making the assumptions and decisions explicit, it enables fair method comparisons and clearer communication of annotation uncertainty. The GIST group hopes this resource will help researchers and practitioners measure progress more honestly and close critical data gaps on the path to net zero.
Journal Reference:
Jacob Beck, Anna Steinberg, Andreas Dimmelmeier, Laia Domenech Burin, Emily Kormanyos, Maurice Fehr & Malte Schierholz, ‘Addressing data gaps in sustainability reporting: A benchmark dataset for greenhouse gas emission extraction’, Scientific Data 12, 1497 (2025). DOI: 10.1038/s41597-025-05664-8
Article Source:
Press Release/Material by Ludwig-Maximilians-Universität München (LMU)
Why the East Antarctic interior is warming faster and earlier than its coastal areas
Scientists have confirmed that East Antarctica’s interior is warming faster than its coastal areas and identified the cause. A 30-year study, published in Nature Communications and led by Nagoya University’s Naoyuki Kurita, has traced this warming to increased warm air flow triggered by temperature changes in the Southern Indian Ocean.
Previously considered an observation “blind spot,” East Antarctica contains most of the world’s glacial ice. This newly identified warming mechanism indicates that current predictions may underestimate the rate of future Antarctic ice loss.
Collecting data in Earth’s most extreme environment
Antarctica, the world’s coldest, driest, and windiest continent, contains about 70% of Earth’s freshwater frozen in its massive ice sheets. Climate change in the region has been studied using data from manned stations located mostly in coastal areas. However, the Antarctic interior has only four manned stations, with long-term climate data available for just two: Amundsen-Scott Station (South Pole) and Vostok Station (East Antarctic Interior). Therefore, the actual state of climate change in the vast interior remained largely undocumented.
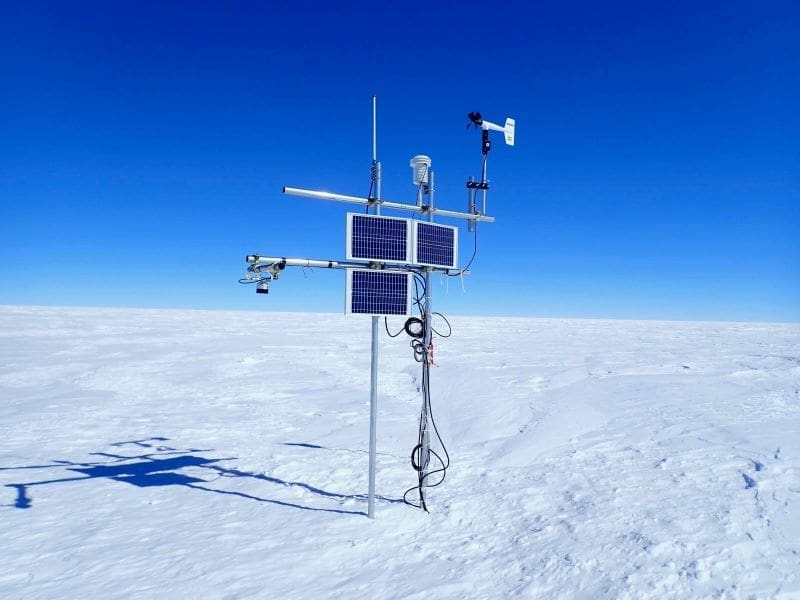
The research group collected observation data from three unmanned weather stations in East Antarctica where observations have continued since the 1990s: Dome Fuji Station, Relay Station, and Mizuho Station. They created a monthly average temperature dataset spanning 30 years, from 1993 to 2022.
Annual average temperature changes showed that all three locations experienced temperature increases at a rate of 0.45-0.72°C per decade, faster than the global average. The researchers analyzed meteorological and oceanic data and traced this temperature rise to changes in the Southern Indian Ocean that alter atmospheric circulation patterns and transport warm air toward Antarctica’s interior.

Current climate models do not capture this warming process, so future projections of temperature for Antarctica may be underestimated. “While interior regions show rapid warming, coastal stations have not yet experienced statistically significant warming trends,” Professor Naoyuki Kurita from the Institute for Space-Earth Environmental Research at Nagoya University said. “However, the intensified warm air flow over 30 years suggests that detectable warming and surface melting could reach coastal areas like Syowa Station soon.”
The Southern Indian Ocean-East Antarctica climate connection
Ocean fronts – areas where warm and cold ocean waters meet – create sharp temperature boundaries in the Southern Indian Ocean. Because global warming heats ocean waters unevenly, it intensifies these temperature differences: stronger oceanic fronts lead to more storm activity and atmospheric changes that create a “dipole” pattern, with low pressure systems in mid-latitudes and high pressure over Antarctica. The high-pressure system over Antarctica pulls warm air southward and carries it deep into the continent.
Now, for the first time, scientists have comprehensive weather station data demonstrating that East Antarctica’s interior is warming faster than its coasts and have identified the major cause of this change. The study provides important insights into how quickly the world’s largest ice reservoir will respond to continued global warming.
Journal Reference:
Kurita, N., Bromwich, D.H., Kameda, T. et al., ‘Summer warming in the East Antarctic interior triggered by southern Indian Ocean warming’, Nature Communications 16, 6764 (2025). DOI: 10.1038/s41467-025-61919-3
Article Source:
Press Release/Material by Nagoya University
Featured image credit: Gerd Altmann | Pixabay


